POS Systems and the Tipping Culture
If we look around, it is not hard to see tipping become more and more common covering more industries compared to even just 5 years ago. Suggested tipping amounts at point-of-sale (POS) devices are also on the rise, which leads to uncomfortable situations for customers.
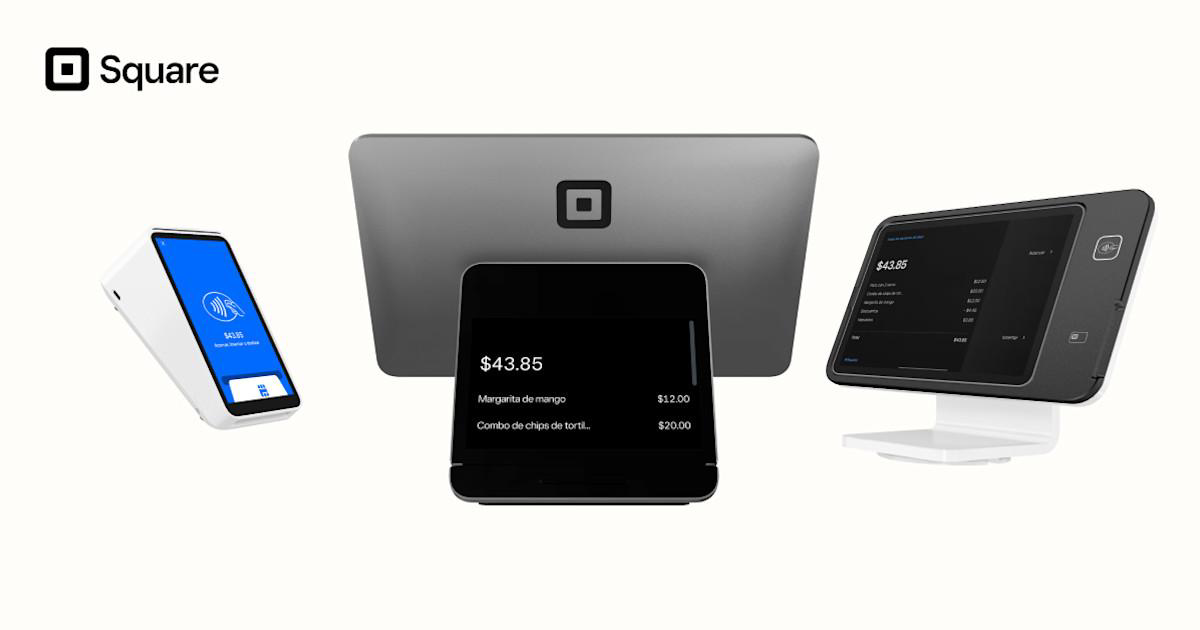
For the final project of the design research class at Duke, my teammates and I talked to people on both sides of these transactions to gain various perspectives and investigate the root of these issues, as well as the pros and cons of current POS systems provided on the market.
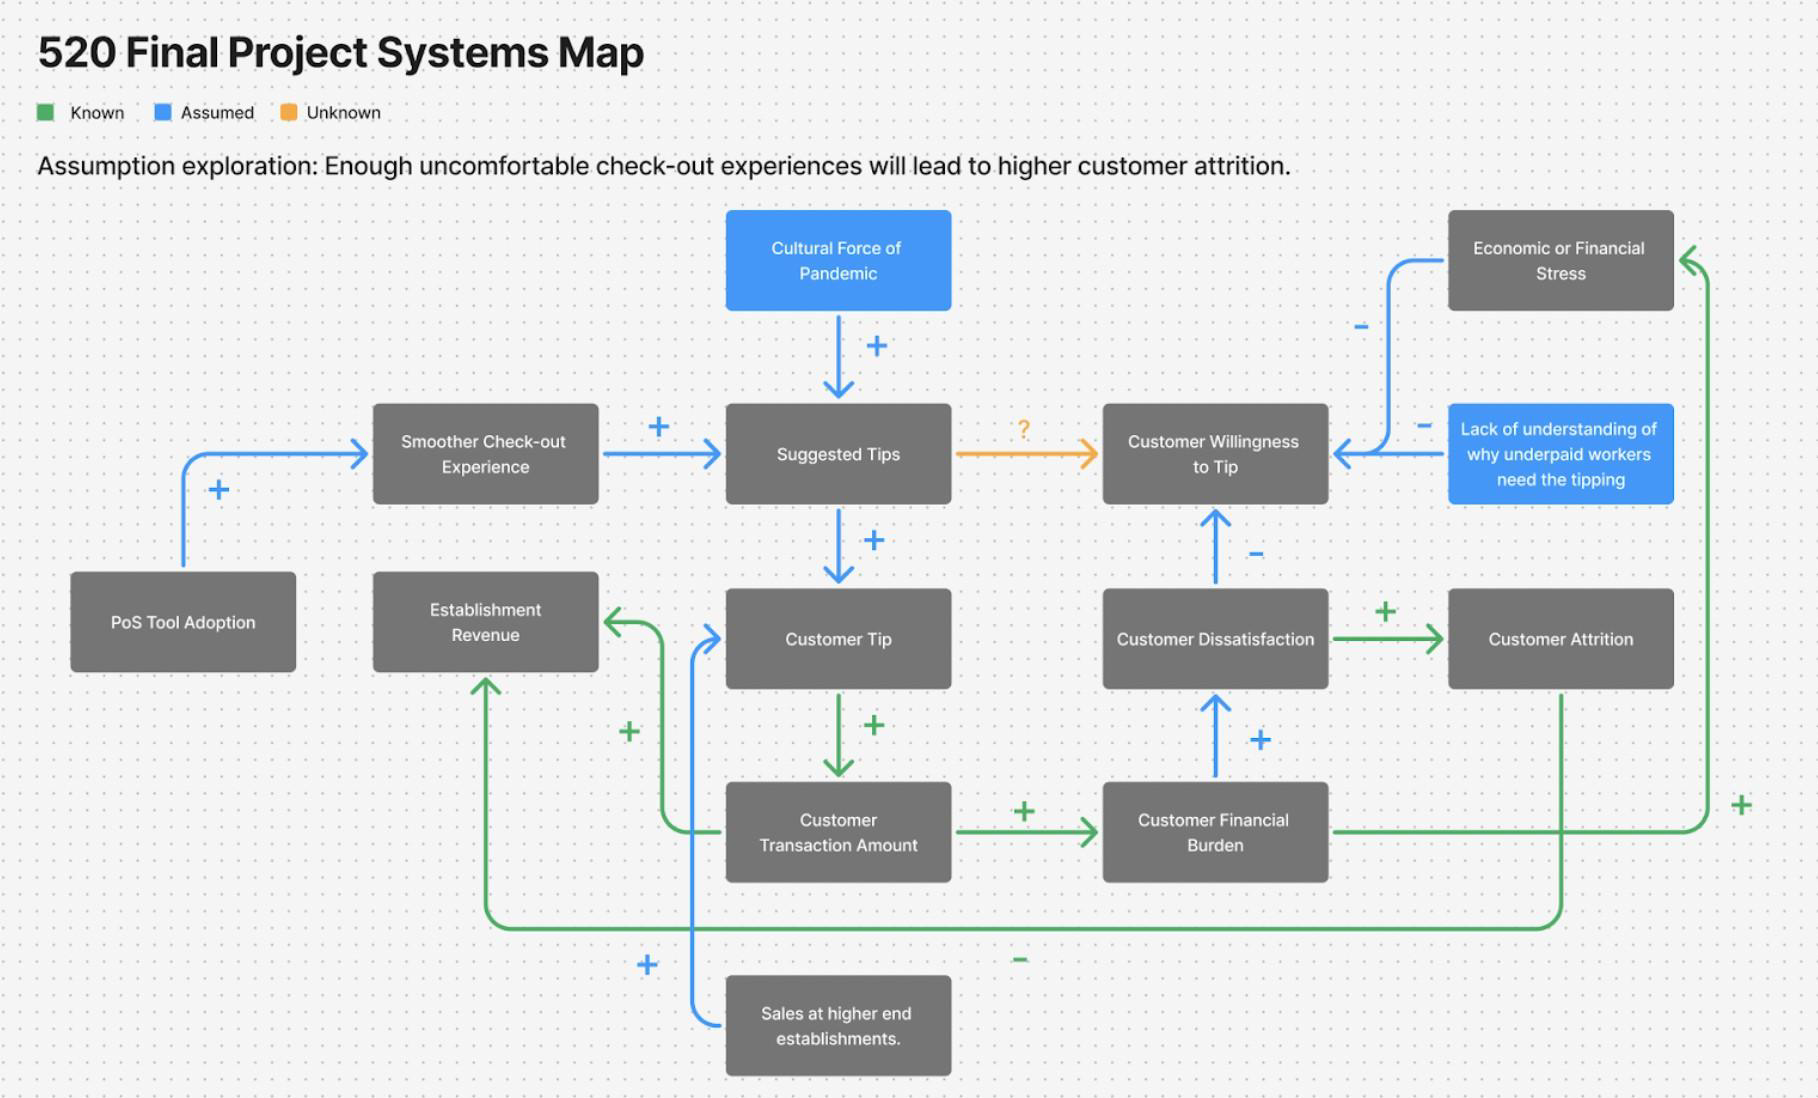
We started off brainstorming around the topic by coming up with assumptions related to feasibility, viability, and desirability, which process got turned into the following system map to help the team quickly grasp the knowledge gap there might exist of the prevalence of tipping culture. These key unknowns guided us narrowing down our priority research goal: to understand the relationship between the suggested tip and customers' experience & willingness to pay.
Research Plan
Goal
To investigate how the design of PoS systems influences tipping behaviors, customer satisfaction, and impacts on the business revenue.
Recruitment
Approached 6 patrons and customers at local cafes, and sourced 2 small business owners through publishing a screener to recruit on Respondent.
Process
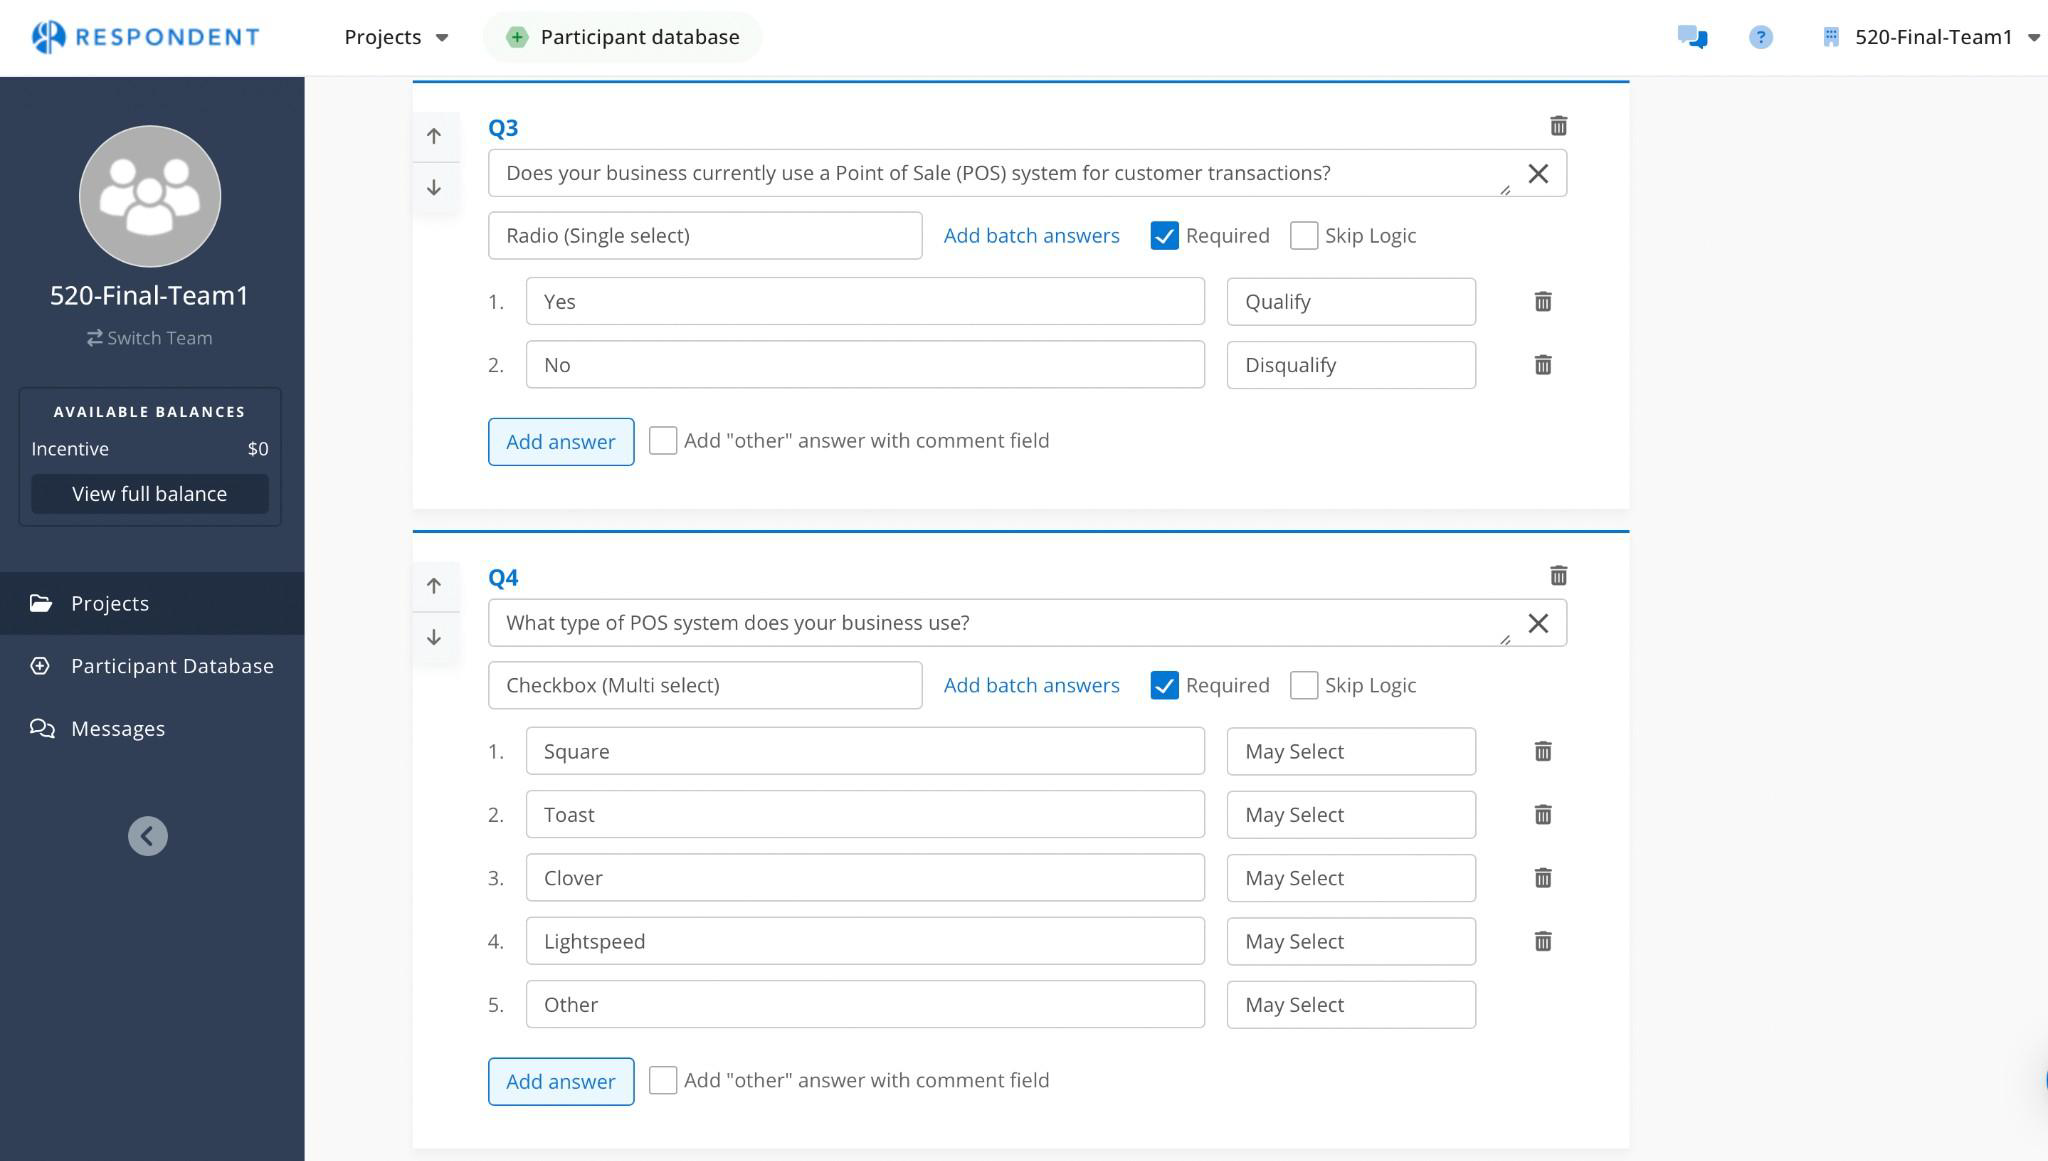
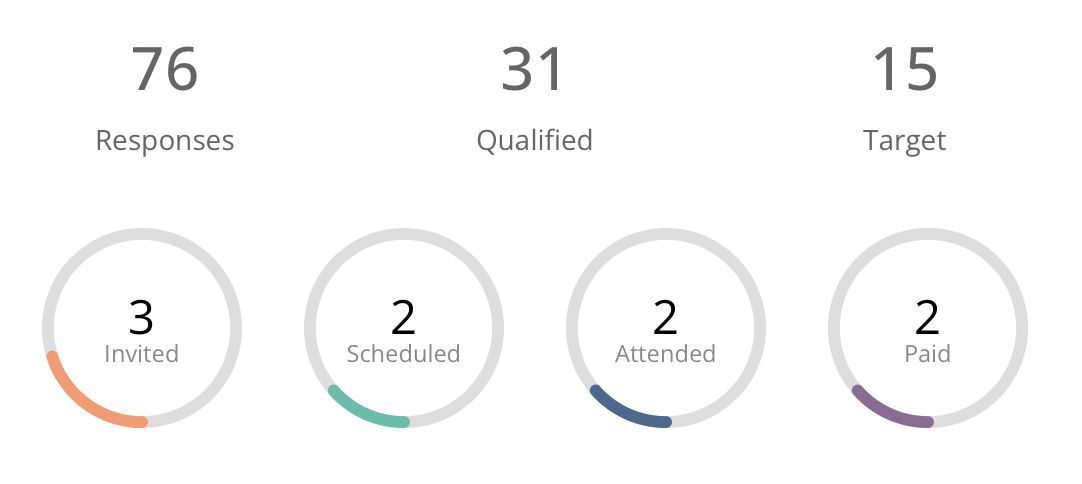
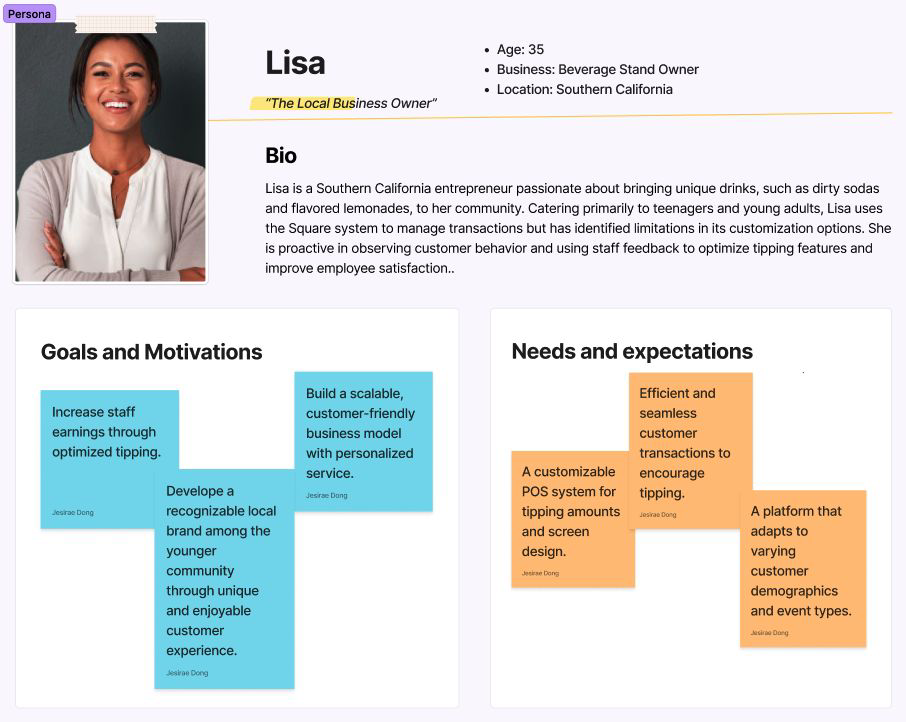
I led user research by designing and conducting interviews with small business owners through Respondent, using screening questions to identify participants in retail and hospitality familiar with POS systems. Within 2 days, I collected 75 responses and identified 32 qualified participants.
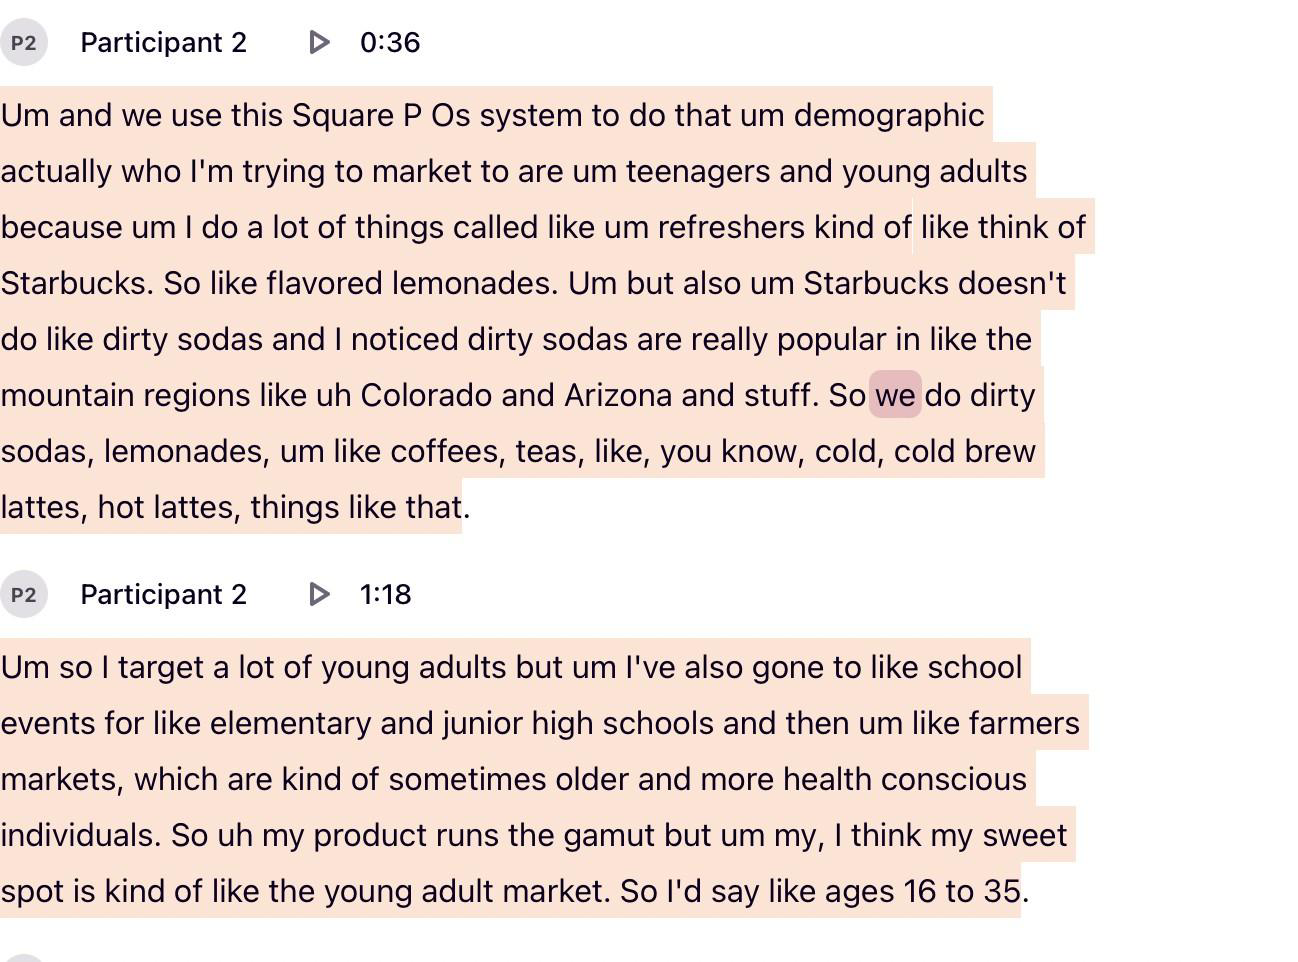
I then analyzed open-ended responses around customer tipping behavior to pinpoint the most engaged interviewees. From this, I selected two key profiles, an artisan soda shop owner in California and a restaurant manager near Vanderbilt University, both of whom offered unique insights into how younger customers interact with tipping prompts at POS terminals. We then used iterative affinity diagramming to identify recurring themes related to tipping practices and POS design.
Key Insights
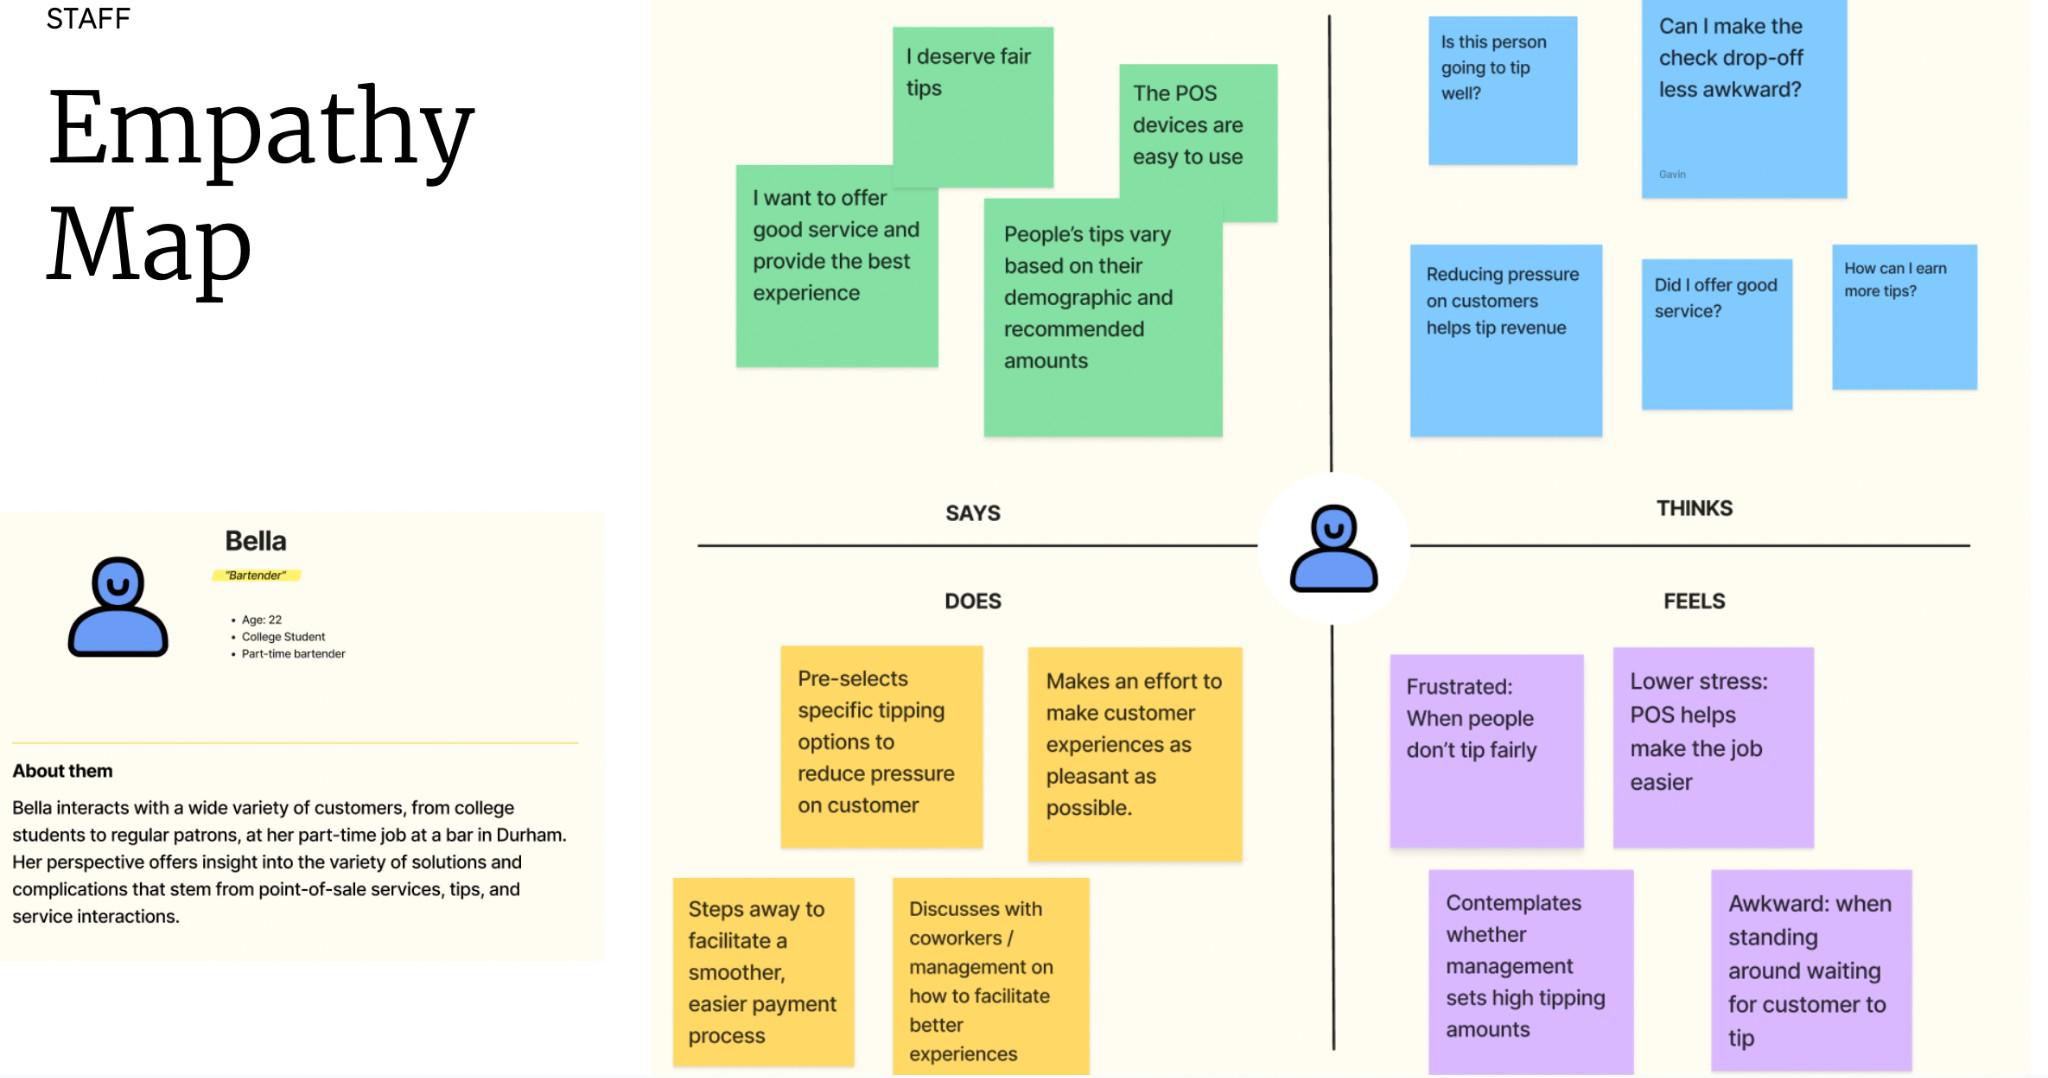
We transcribed interview recordings and used affinity diagramming techniques to color code key themes. Through multiple iterations, we identified insights related to customer discomfort, staff experiences, and business needs.
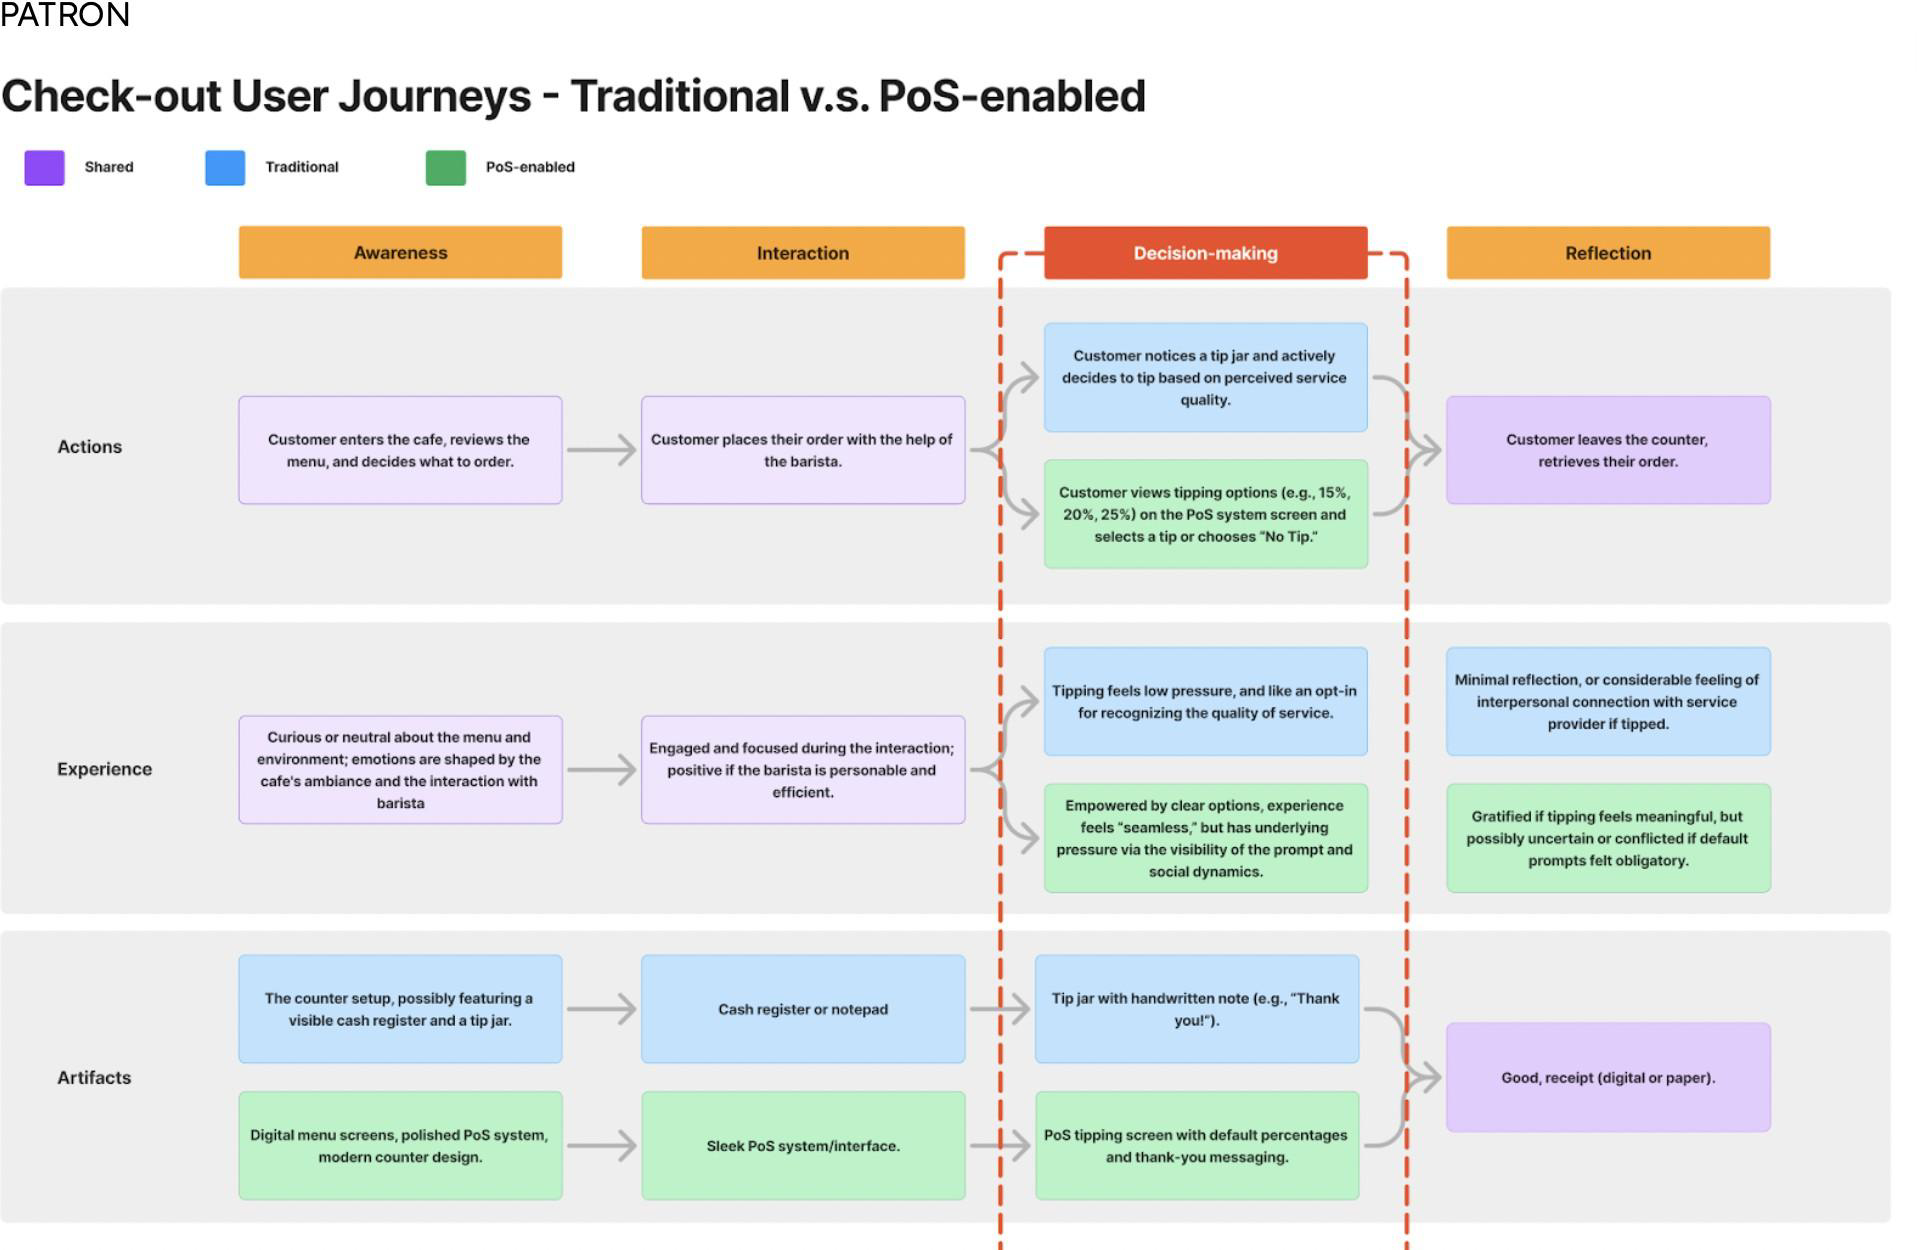
- Opt-Out: Traditional tip jars are opt-in, while PoS systems introduce opt-out models.
- Guilt & Pressure: High default tips pressure customers and reduce satisfaction.
- Staff Influence: Staff discretion in prompting tips impacts trust and experience.
- Ethical Concerns: Customers fear high tip suggestions reflect poor staff compensation.
- Customization Needs: Business owners seek more flexible tipping options based on service type and hours.
Design Opportunities
- Trust-Building Interfaces: Personalized messages to build rapport during checkout.
- Customizable Prompts: Allow businesses to adapt tipping options to service type and customer demographics.
- Transparency Features: Inform customers about how tips benefit staff to reduce ethical concerns.
How might we design a check-out experience that prioritizes human connection?
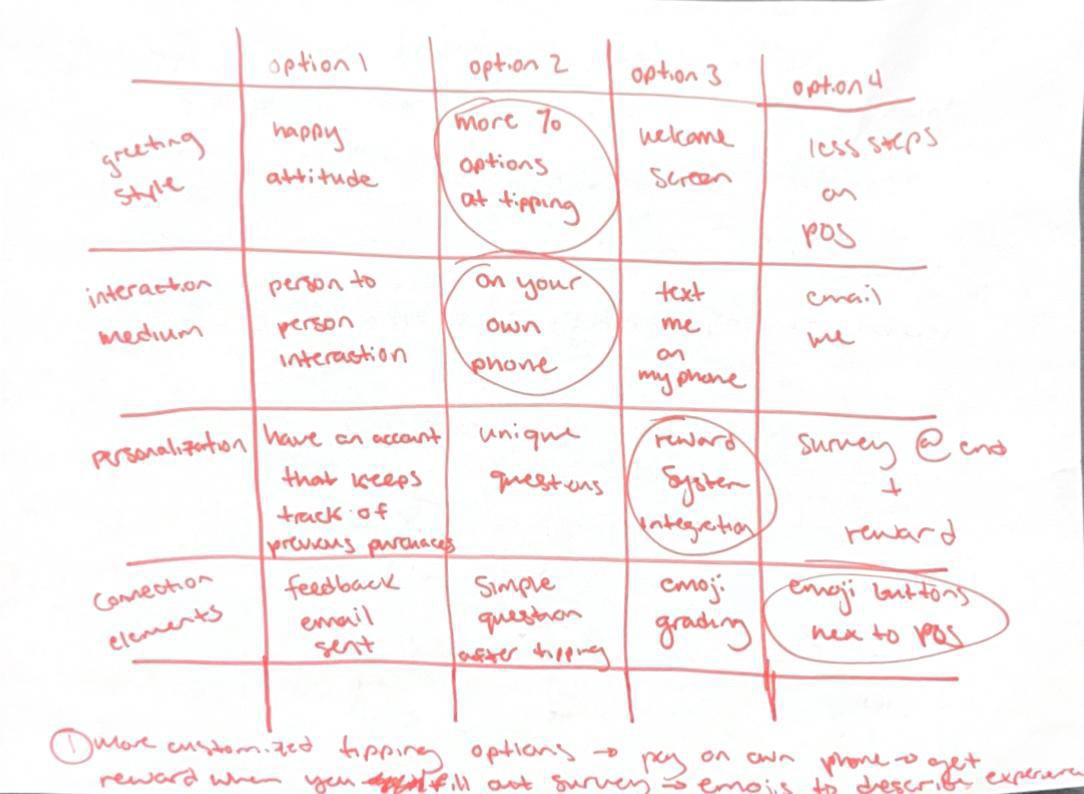
Diverge With Morphological Matrix (25 Results)
| Factor | Option 1 | Option 2 | Option 3 |
|---|---|---|---|
| Greeting style | Verbal welcome | ||
| Interaction medium | Human cashier | Self-checkout | Virtual assistant |
| Personalization level | Name recognition | Tailored suggestions | Universal experience |
| Connection elements | Conversation prompts | Shared moments | Feedback opportunity |
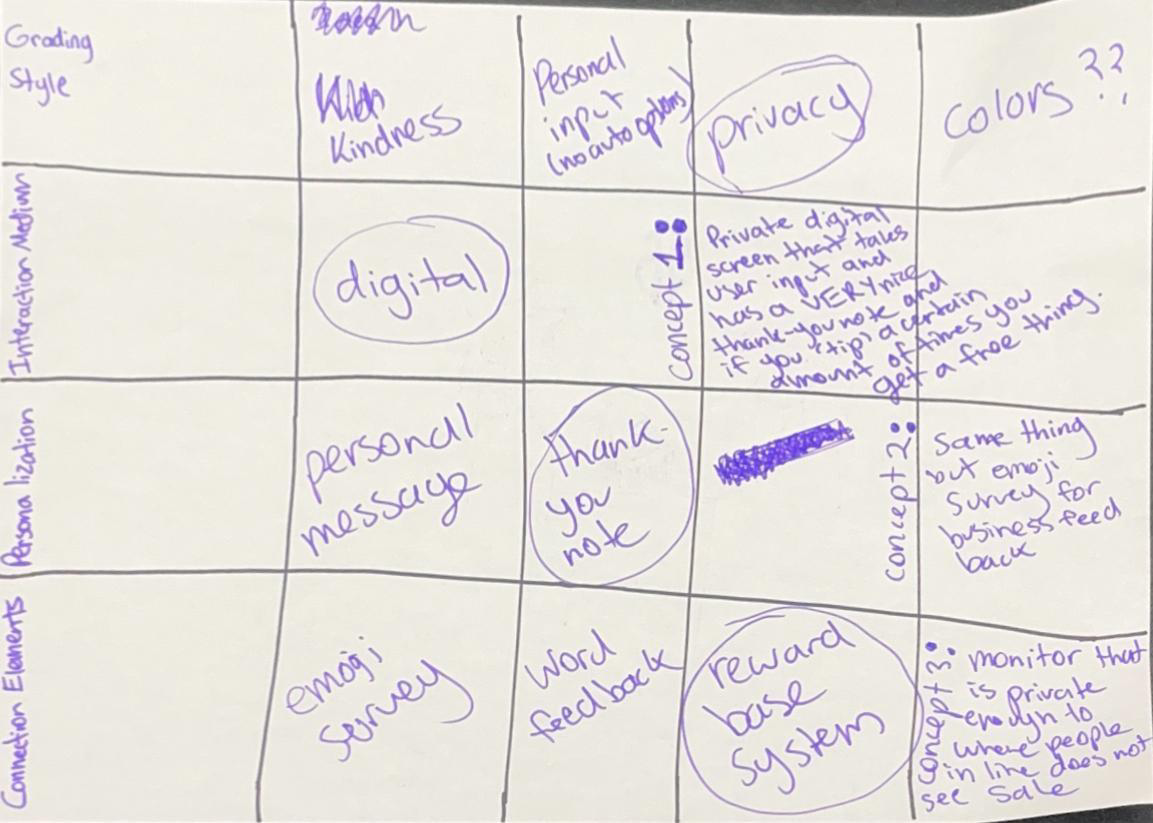
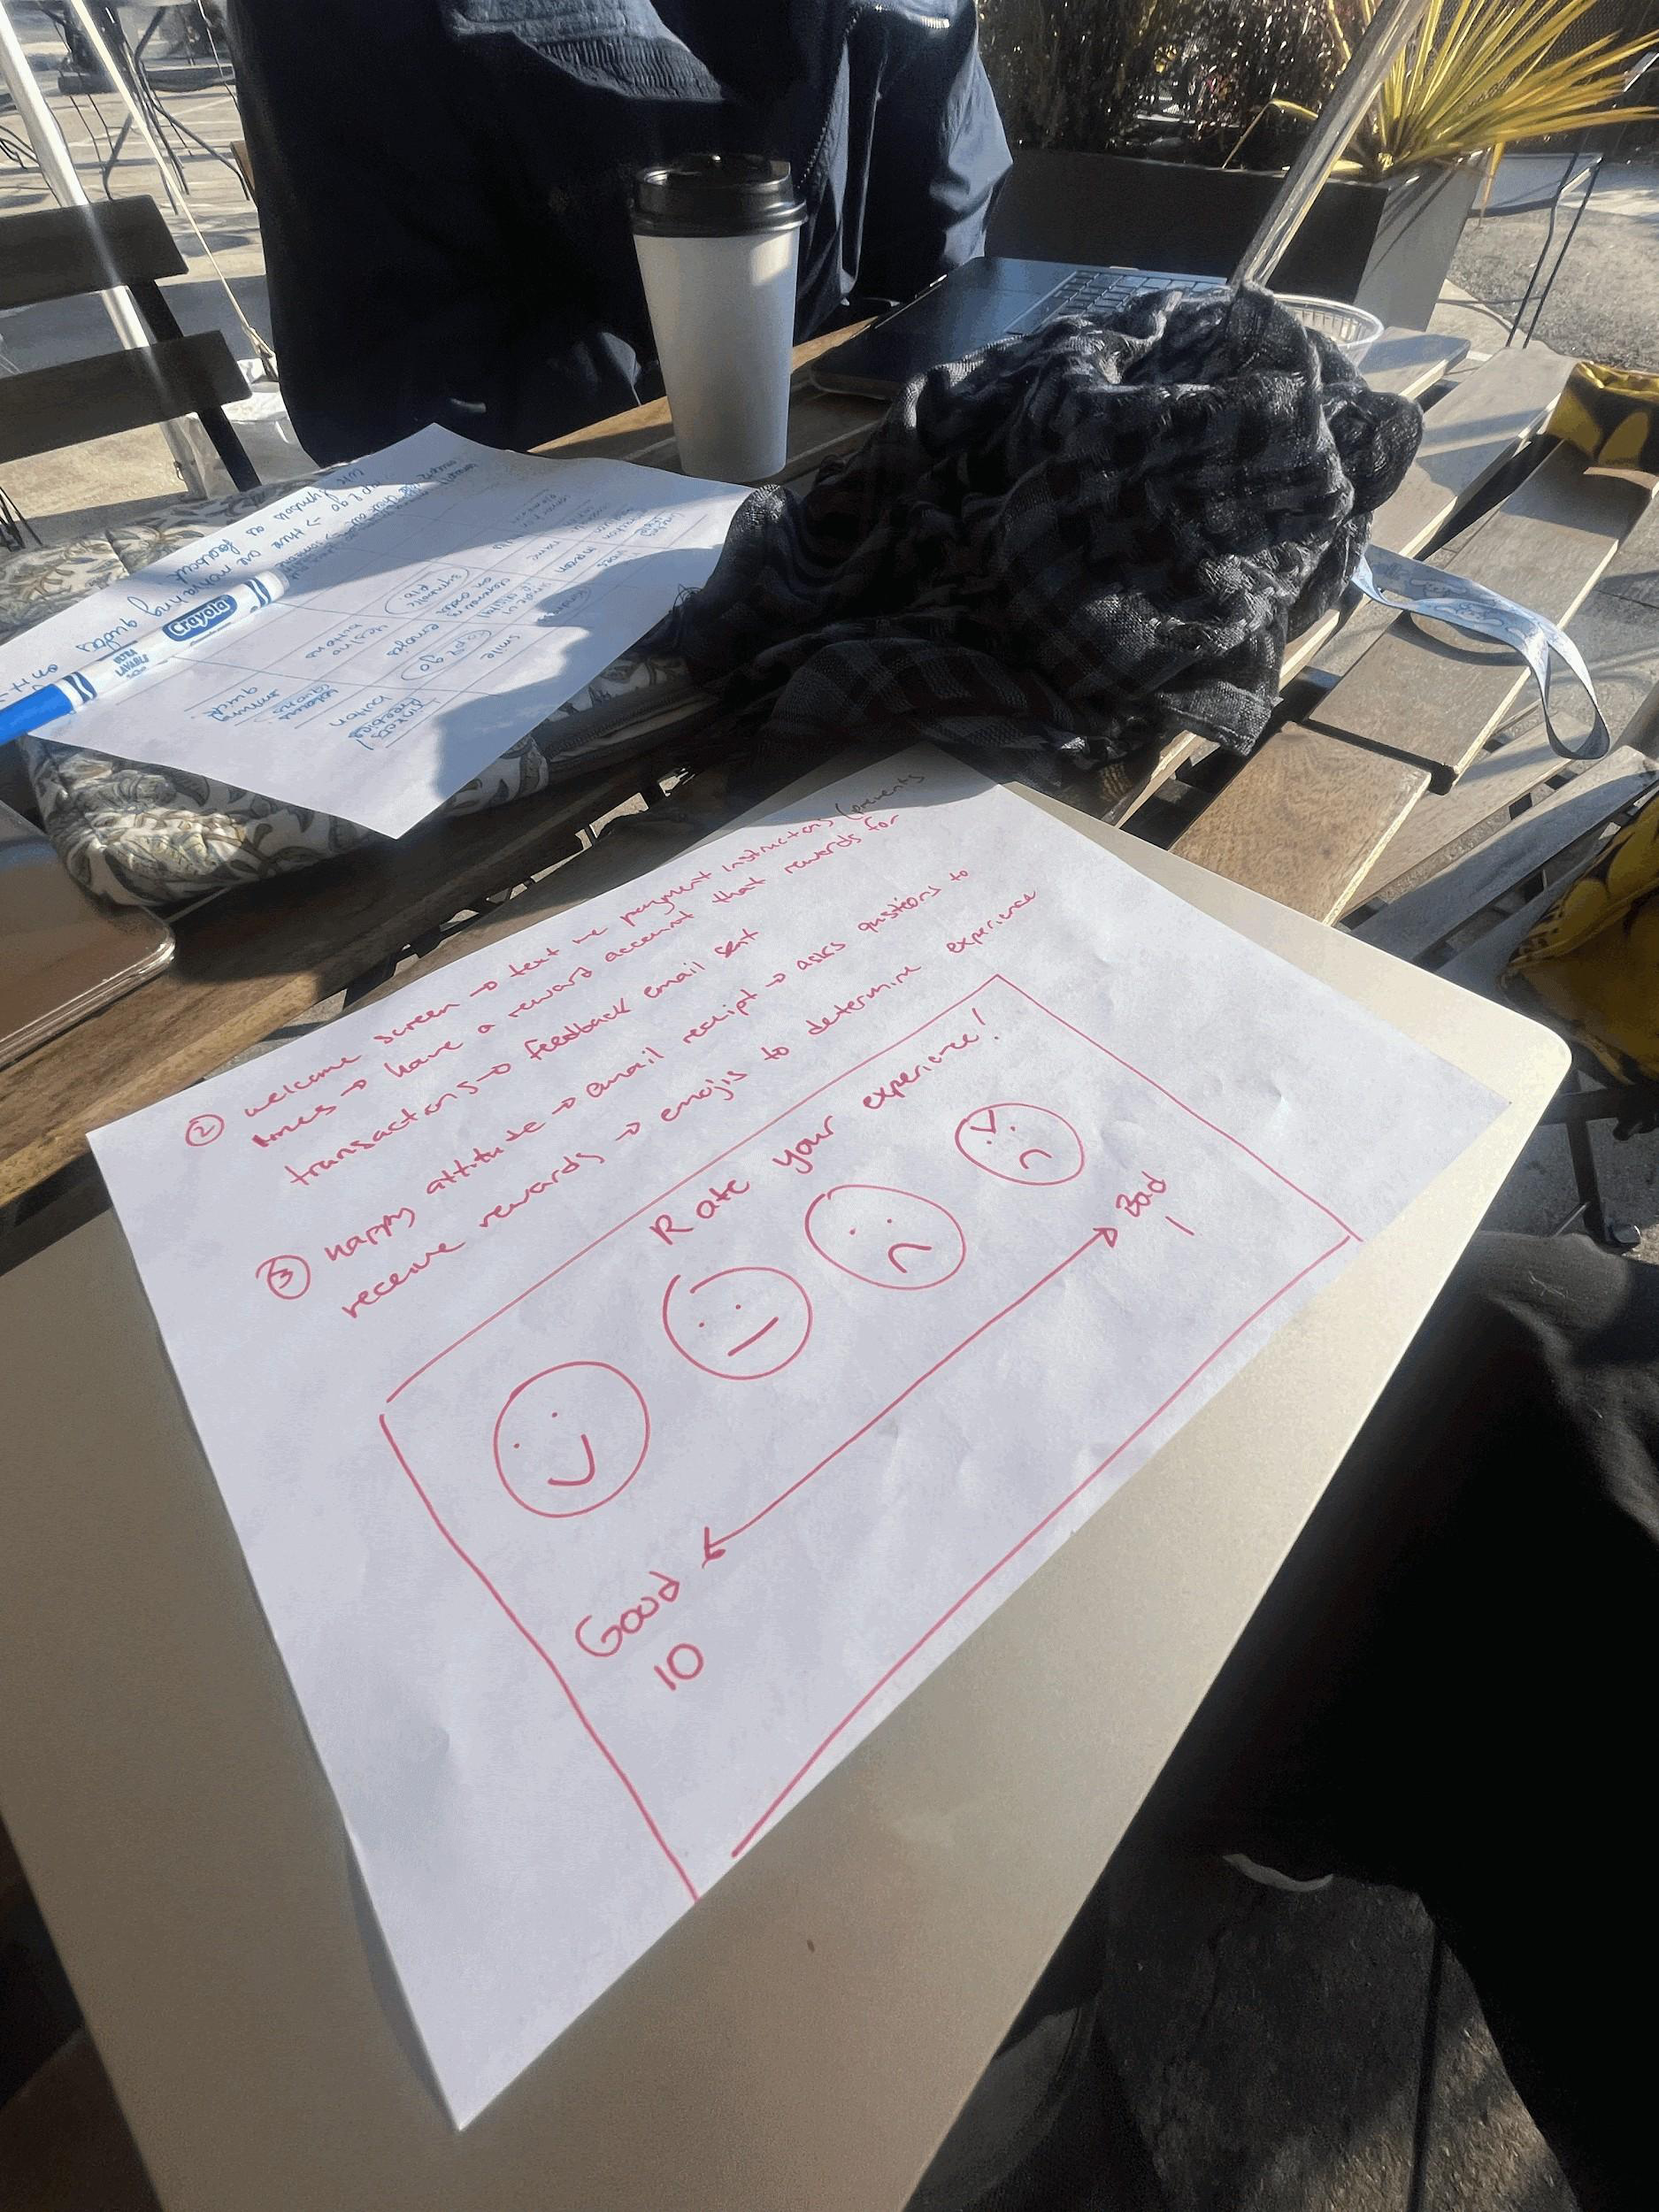
Converge With Prioritization Matrix And Dot Voting
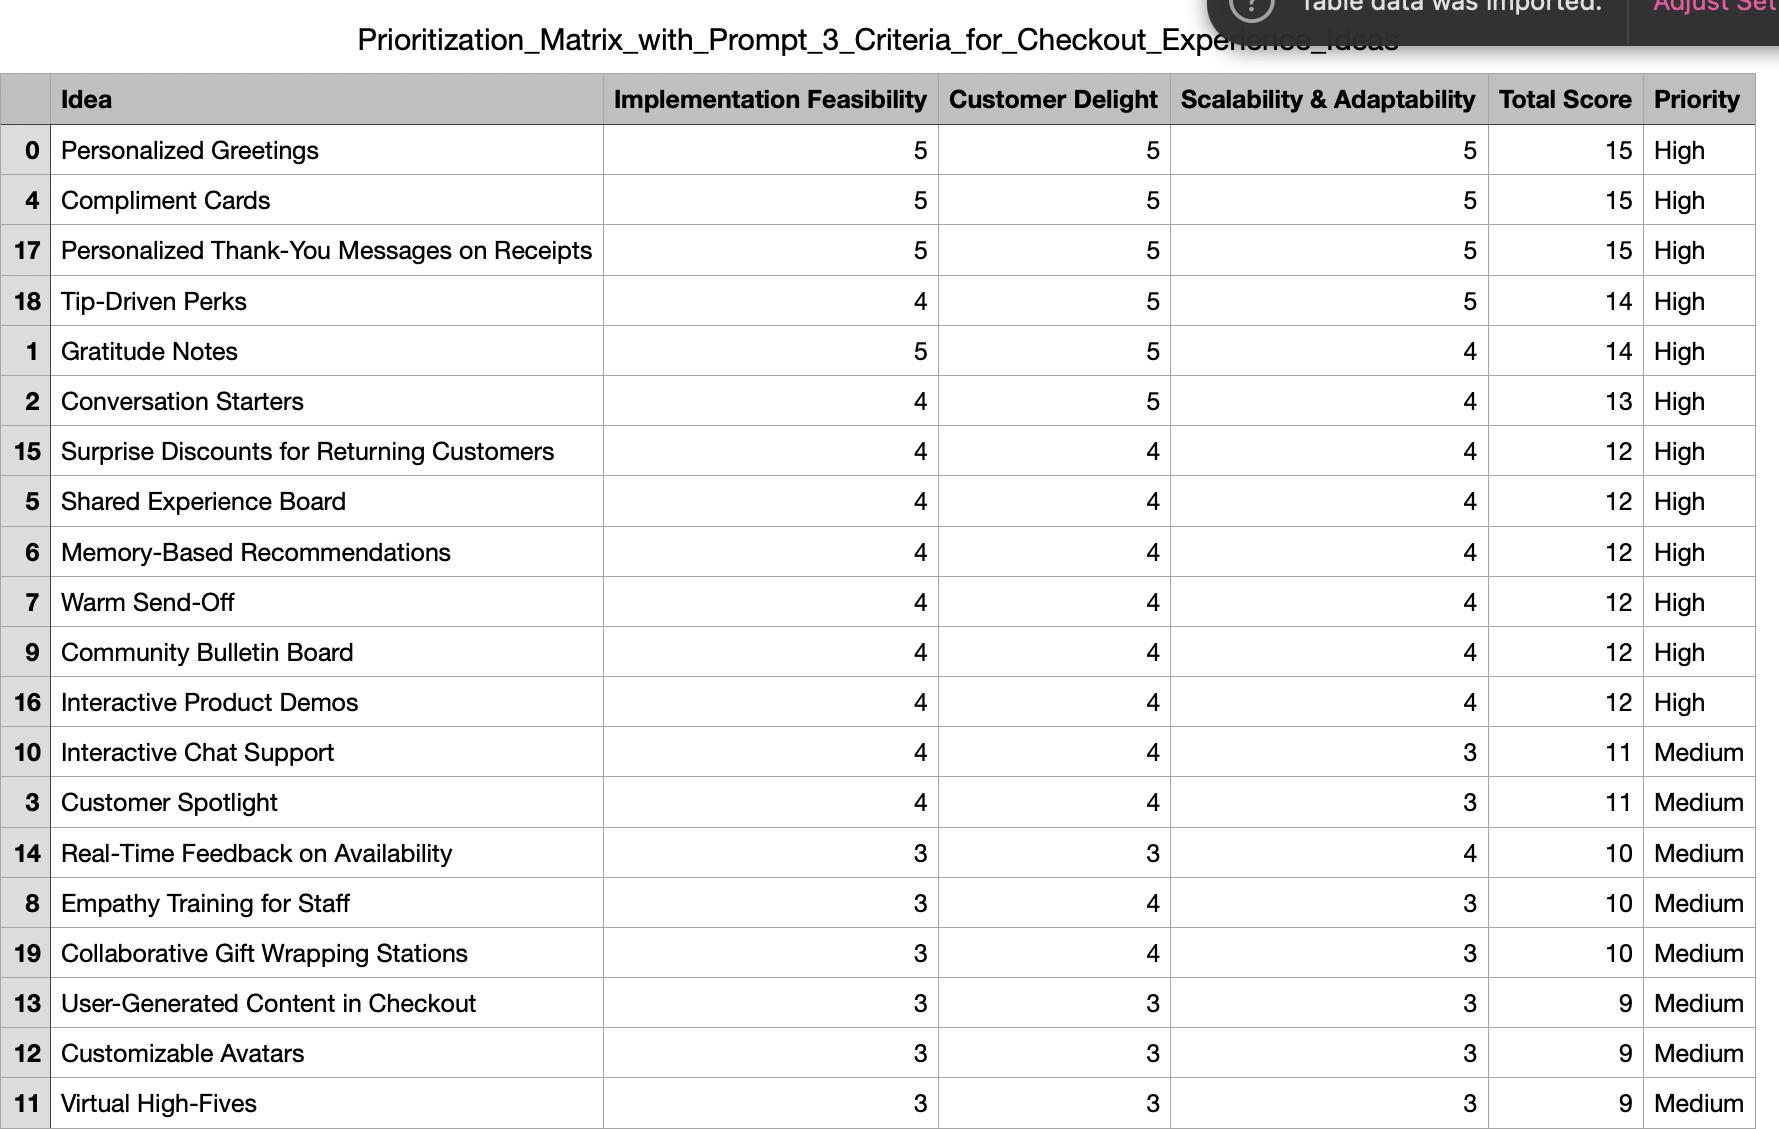
Criteria and Scale: score each idea out of 15 and group them into high (12–15), medium (8–11), or low (below 8) priority. Combine overlapping ideas where possible and create 3–5 refined concepts that maximize emotional connection while remaining scalable and feasible.
Feasibility 1–5
How practical and cost-effective is it to implement this idea?
Emotional Impact 1–5
How well does the idea foster meaningful connections and positive experiences for users?
Scalability 1–5
Can this idea be easily scaled across multiple locations or adapted for diverse contexts?
Refined Concepts
Tip-Driven Rewards Program
Tip-driven perks + surprise discountsA gamified tipping system that rewards customers for tipping generously. Customers unlock perks like discounts, free items, or loyalty points based on their tip amount. Staff complement this by expressing gratitude with personalized thank-you messages.
Community Connection Wall
Shared experience board + bulletin boardA physical or digital space near the checkout where customers can leave positive notes, doodles, or share stories about their experiences. Businesses can highlight standout contributions, fostering a sense of collaboration and community among patrons.
Personalized Gratitude System
Greetings + compliment cards + notesA system where staff provide personalized thank-you notes and compliment cards tailored to each customer. These can be handwritten or presented digitally via a receipt or screen. Staff also greet customers by name (from loyalty programs) to add a warm, personal touch.
Concept Realization
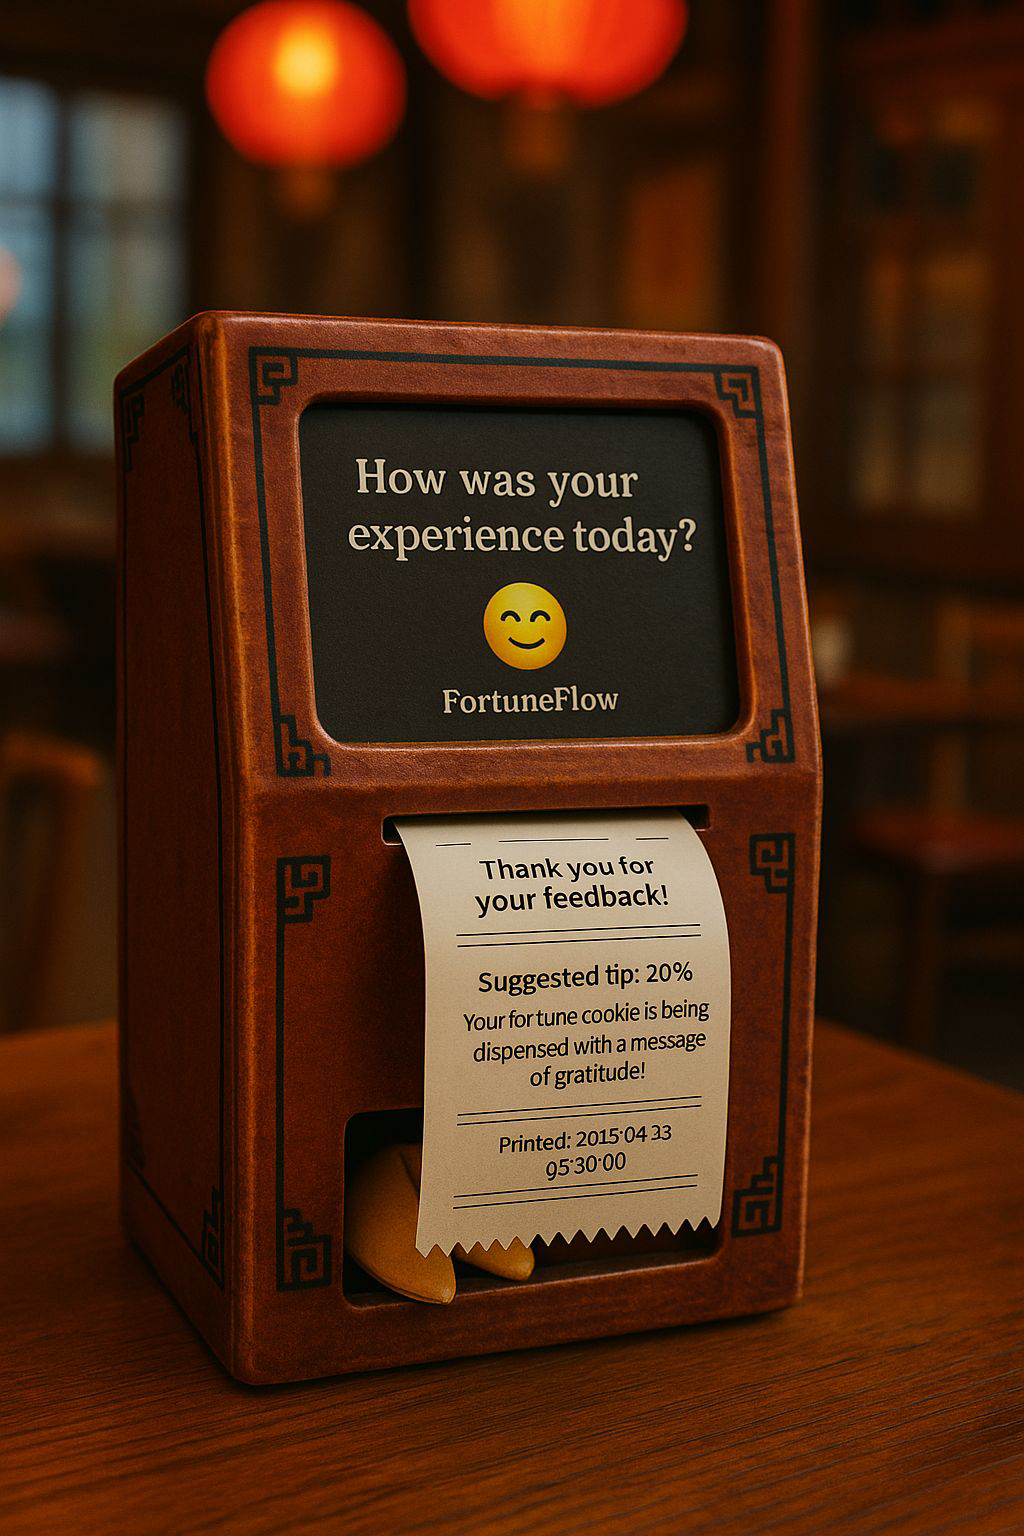
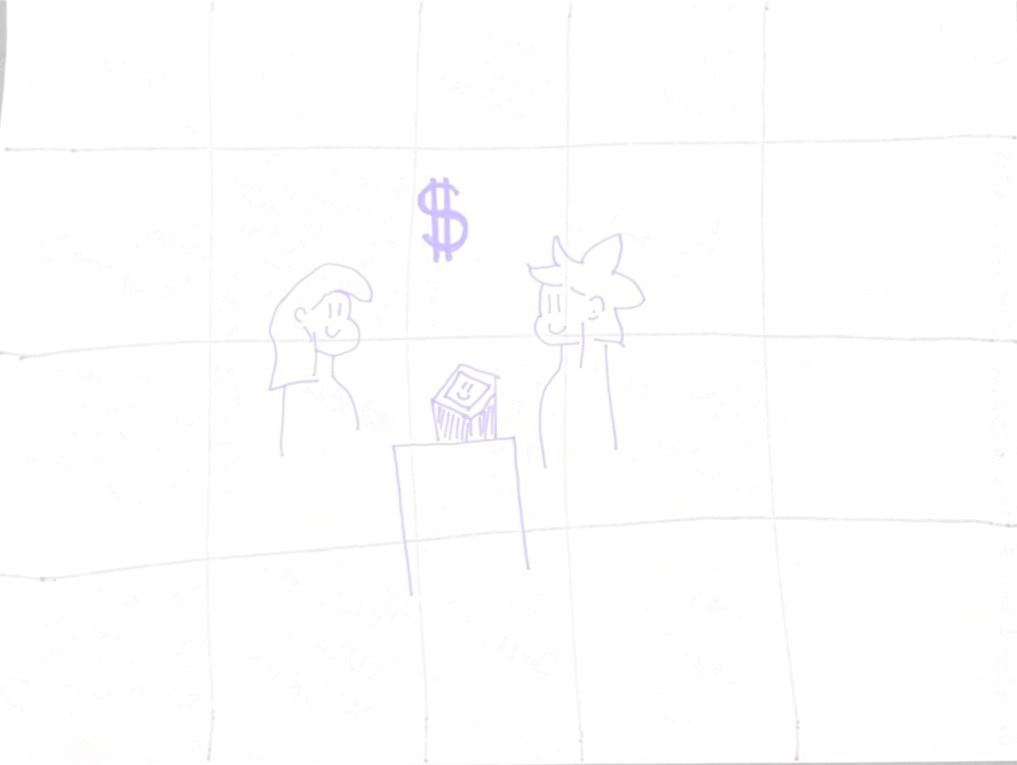
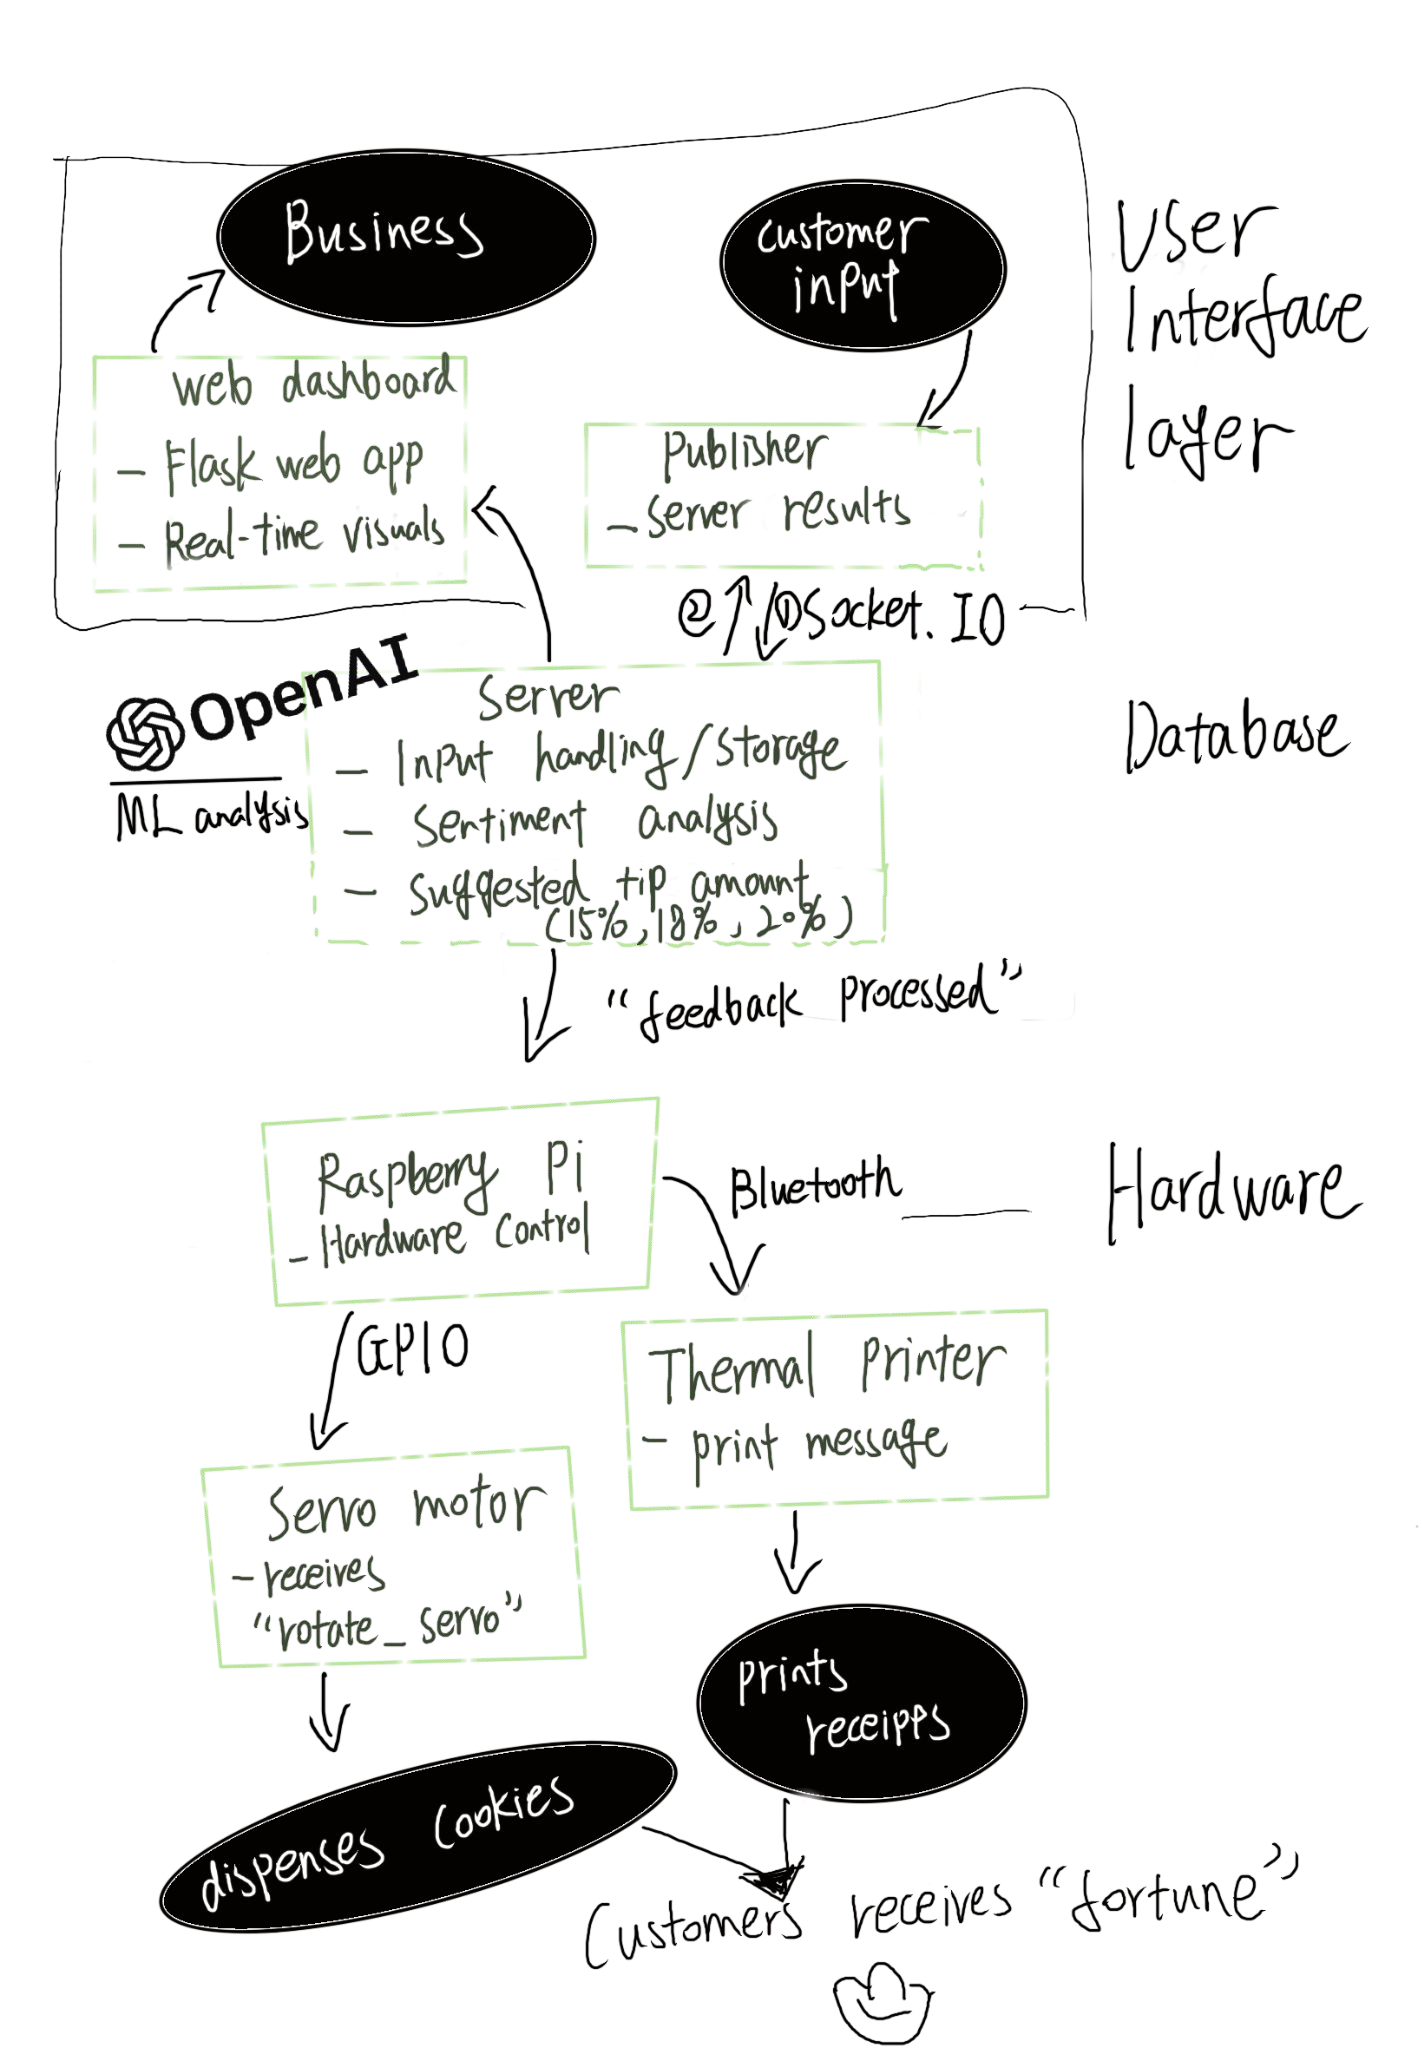
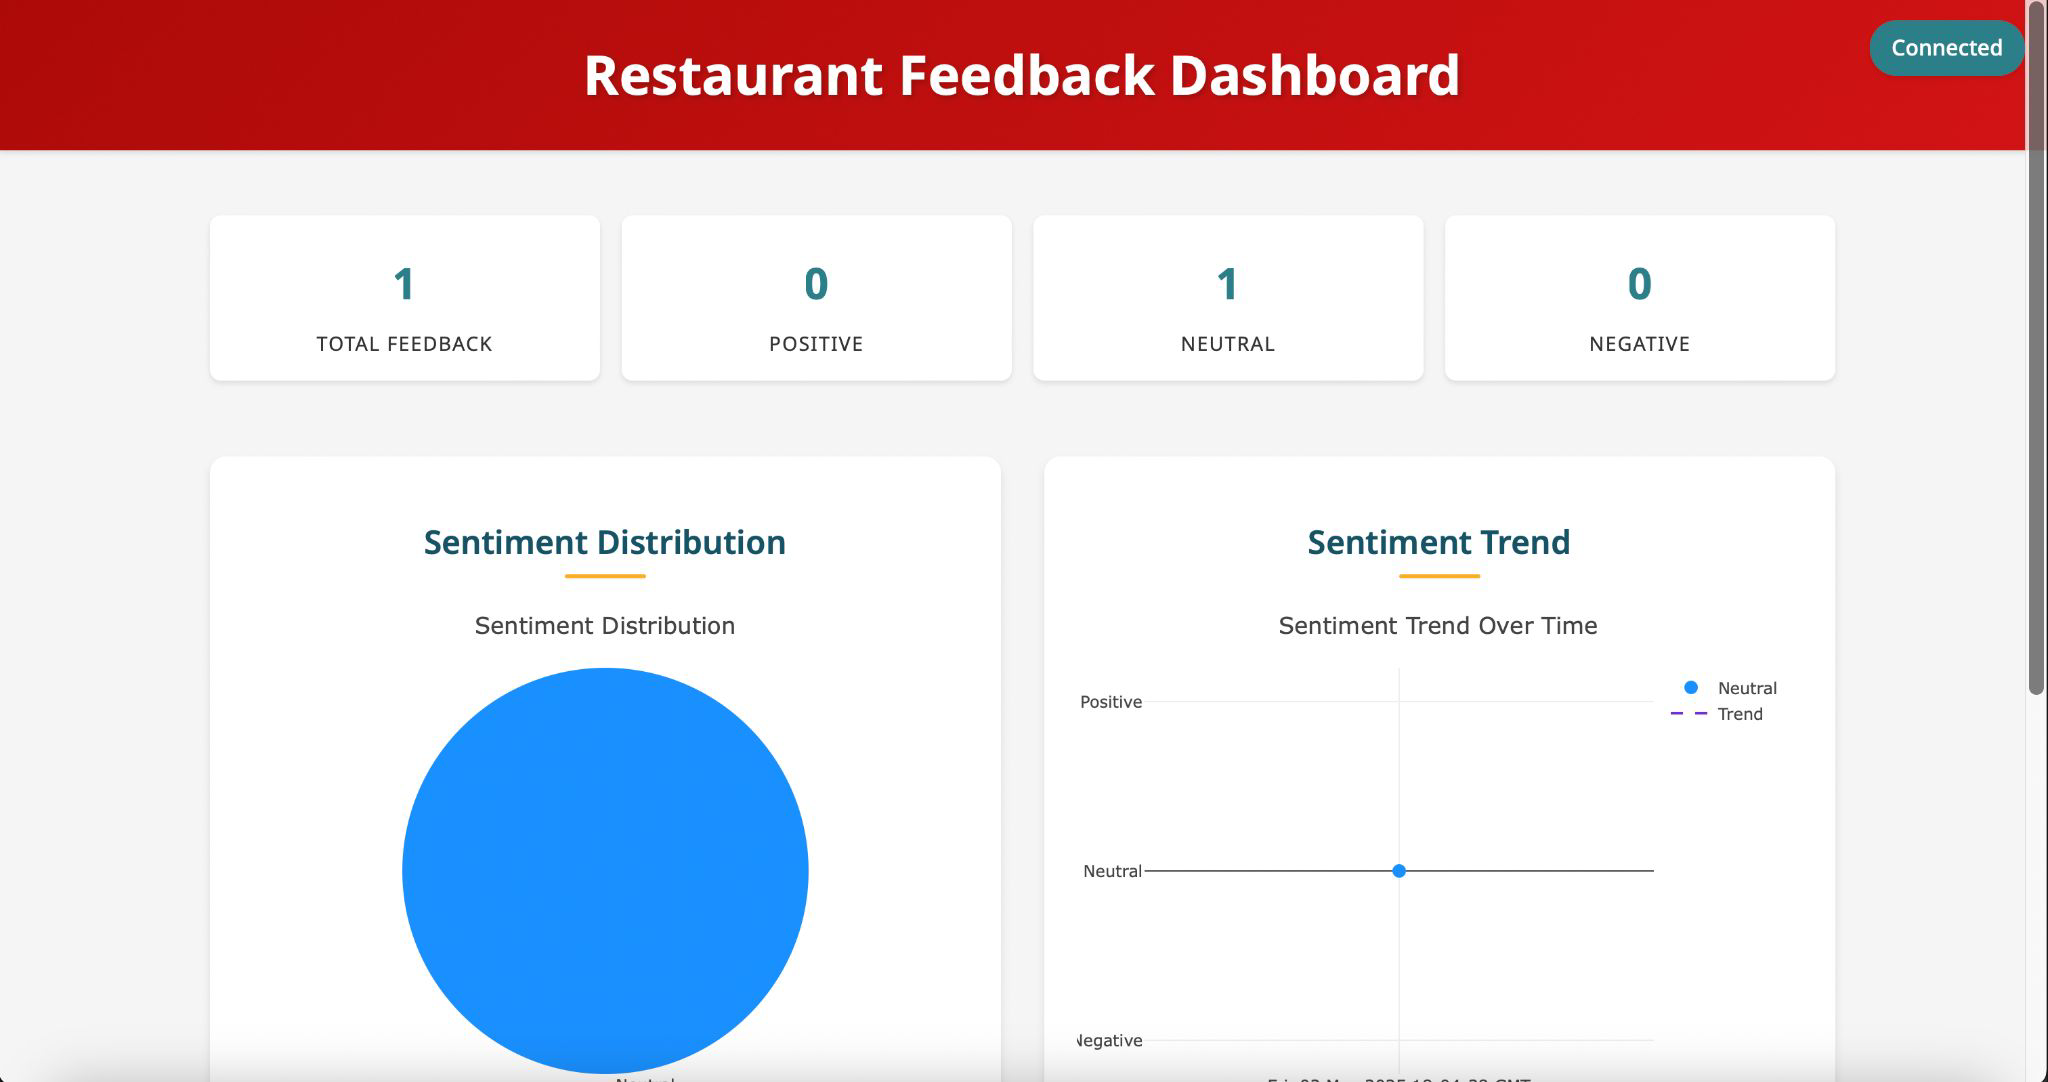
A countertop kiosk that invites customers to reflect on their experience. They leave feedback, receive a fortune cookie tied to their mood, and get a custom receipt that subtly nudges tipping. It’s culturally meaningful and emotionally engaging by bringing back the charm of incentivising customers.
Fabrication I
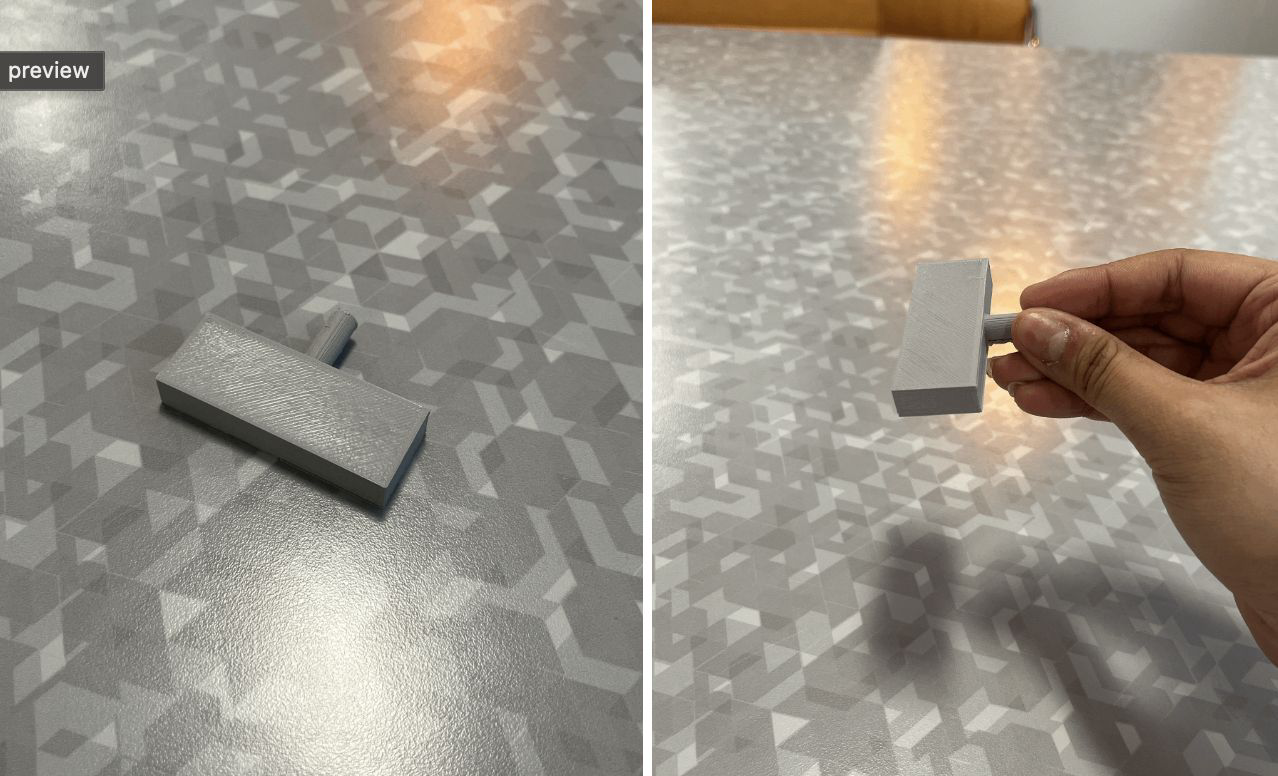
My first fabrication was a 3D printed knob designed as a rotational input to connect with the motor and trigger cookie dispensing based on sentiment. The initial version had a cylindrical shaft and a flat base, meant for testing the angle of cookie release. While the form aligned with my design intent, I discovered the cookie dispensing lacked precision — the knob didn't reliably control a one-cookie drop. This led me to rework the geometry, including resizing the base and exploring the need for "selection zones" with stopping points or ridged edges to prevent unintentional rotation.
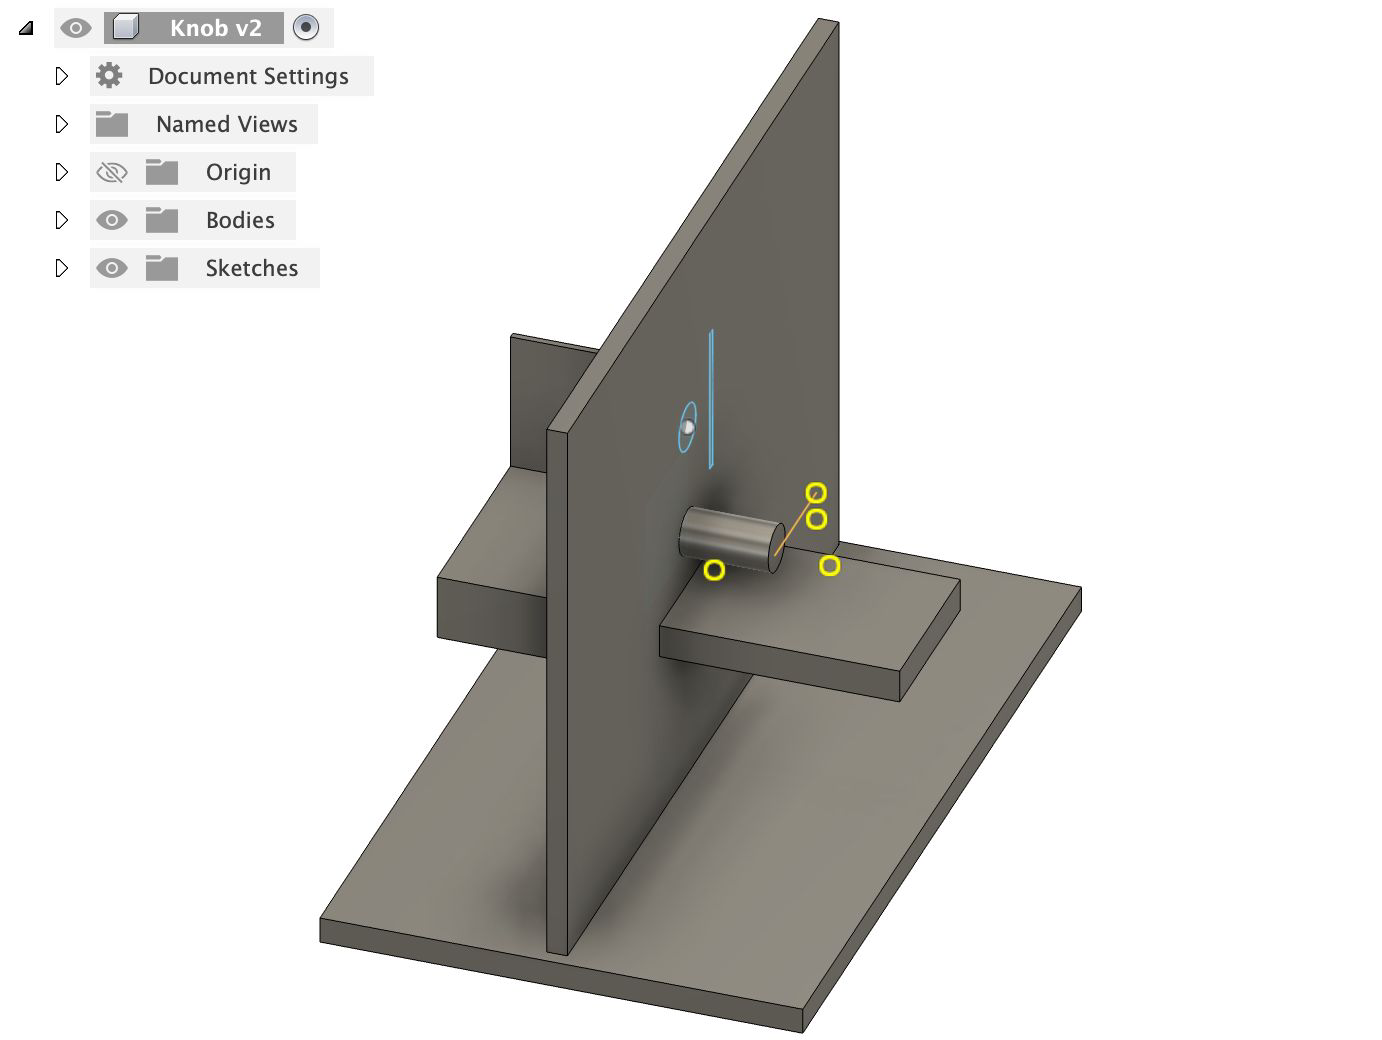
Initial CAD
I initially tried to use CAD to figure out the dispensing mechanism, and later on found it easier to experiment with smaller and more mobile pieces made with laser cut, which is what led me to my second fabrication.
Fabrication II
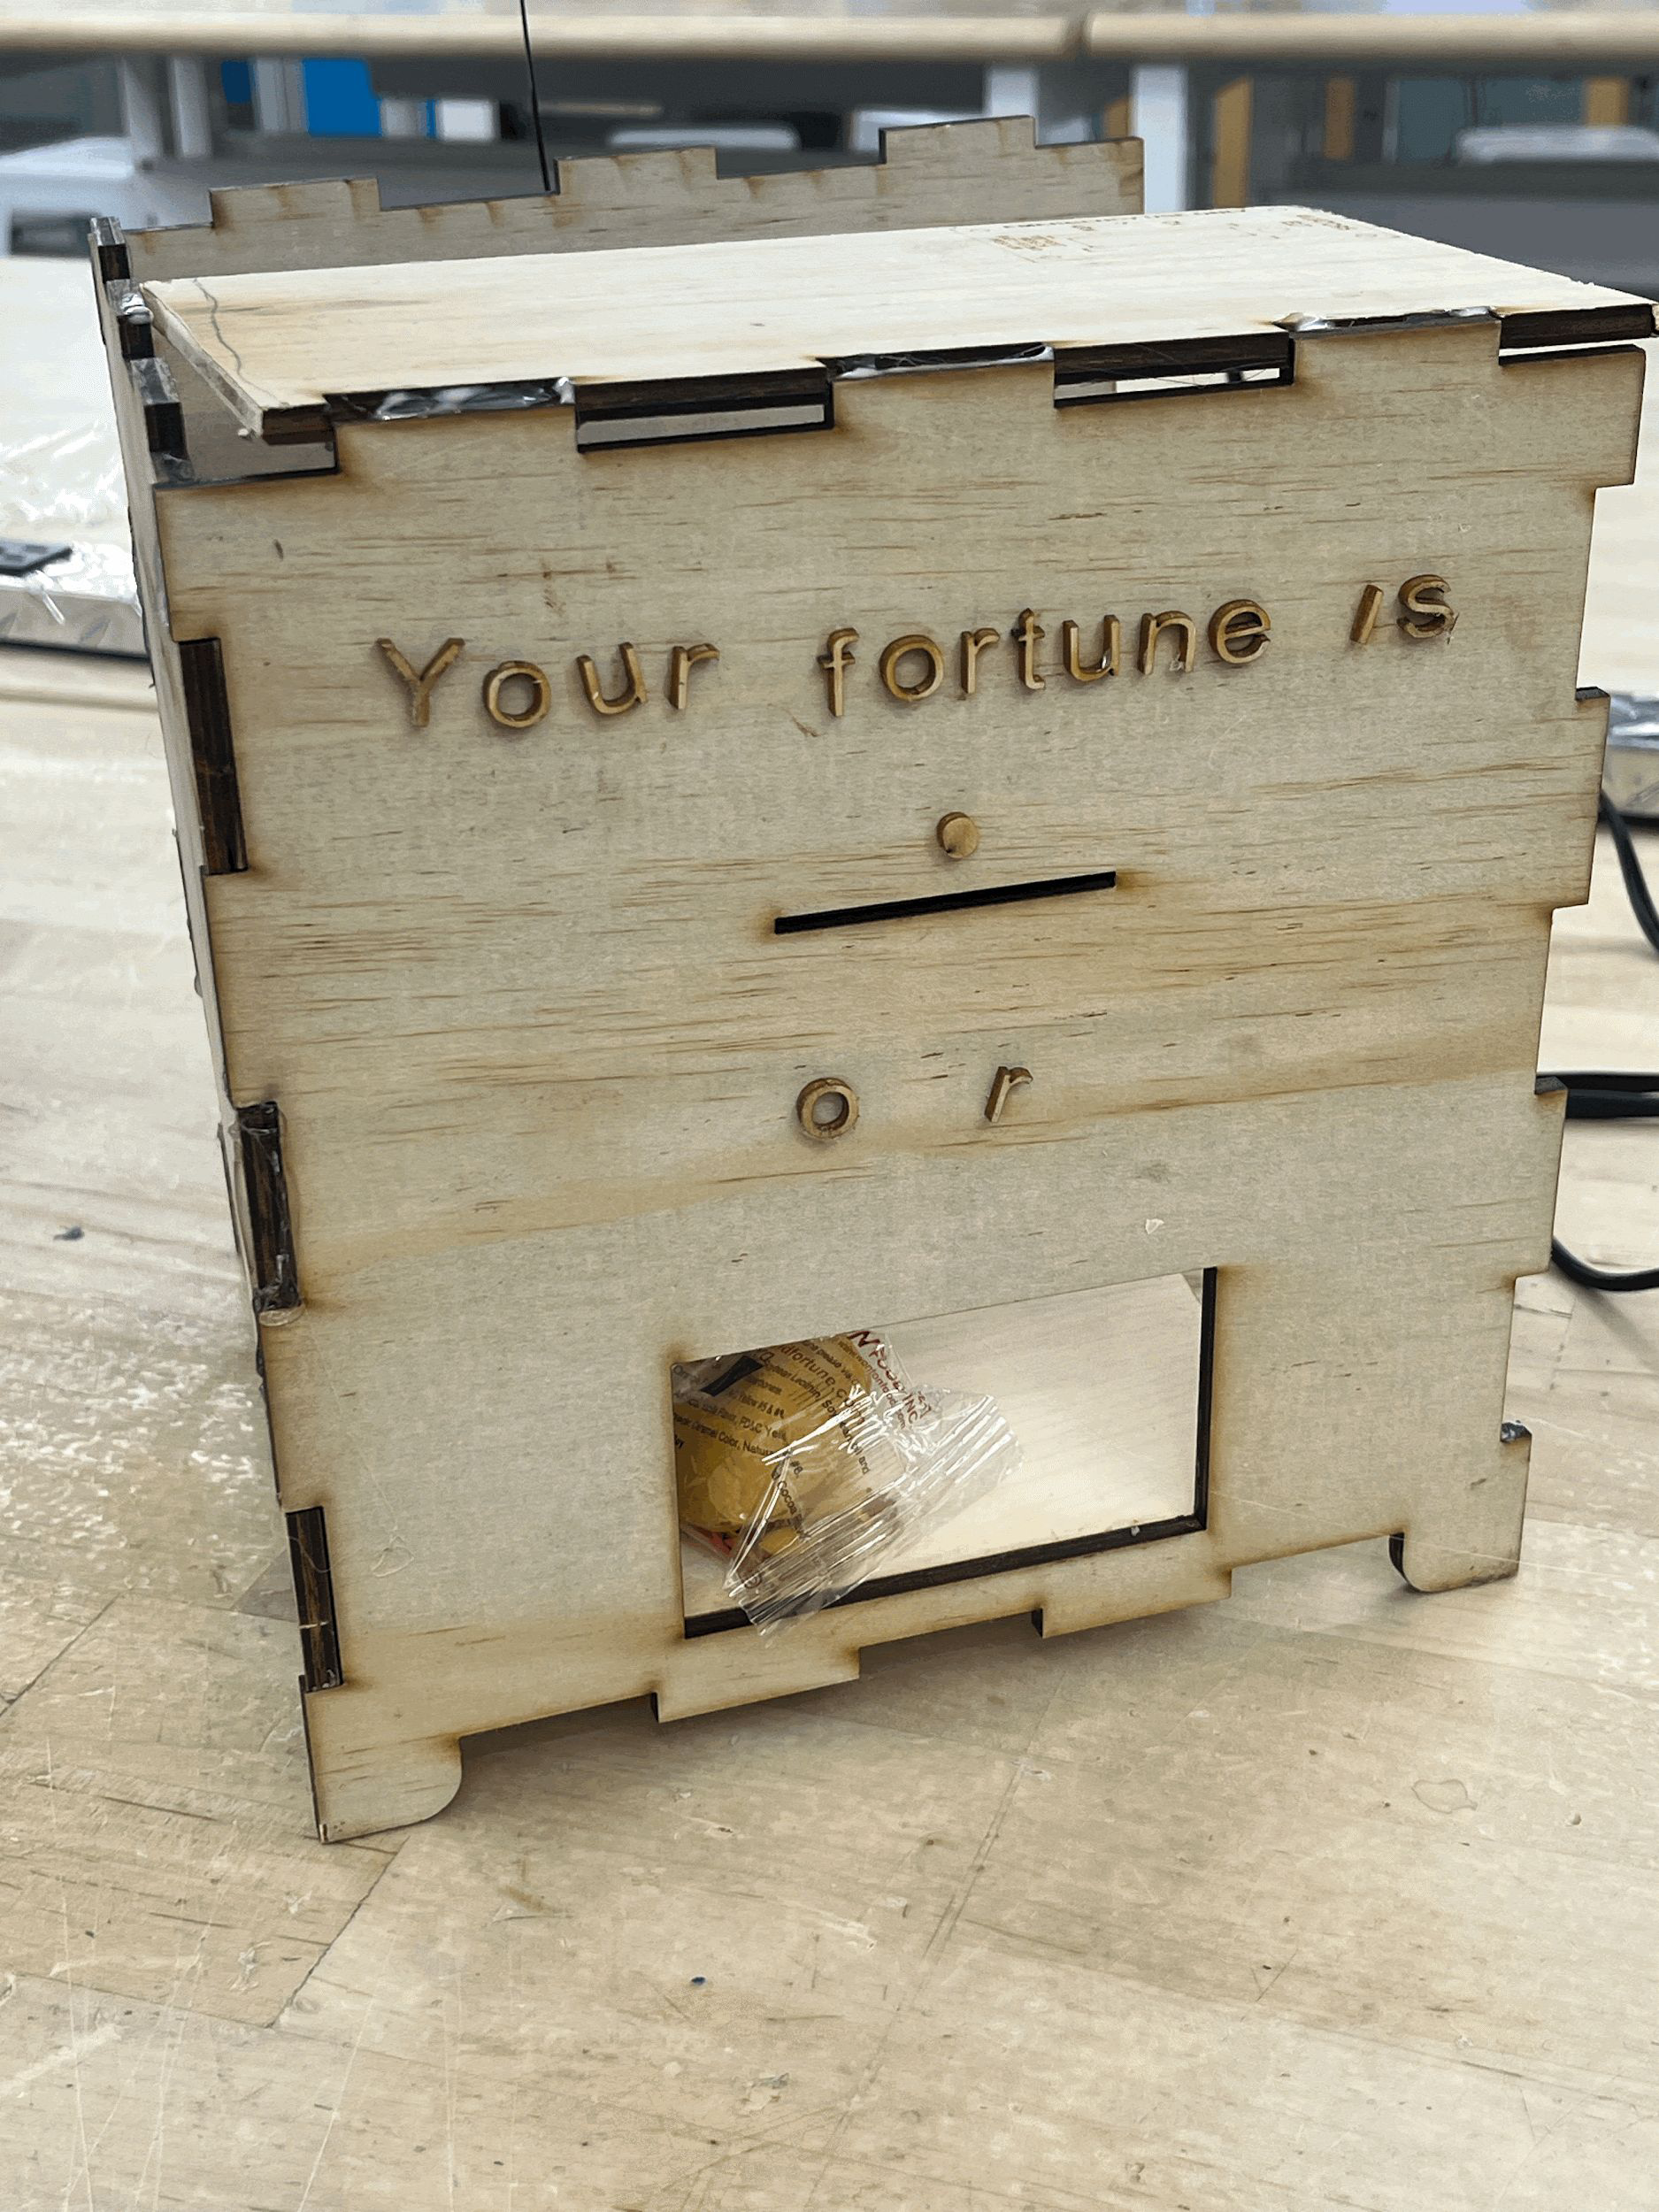
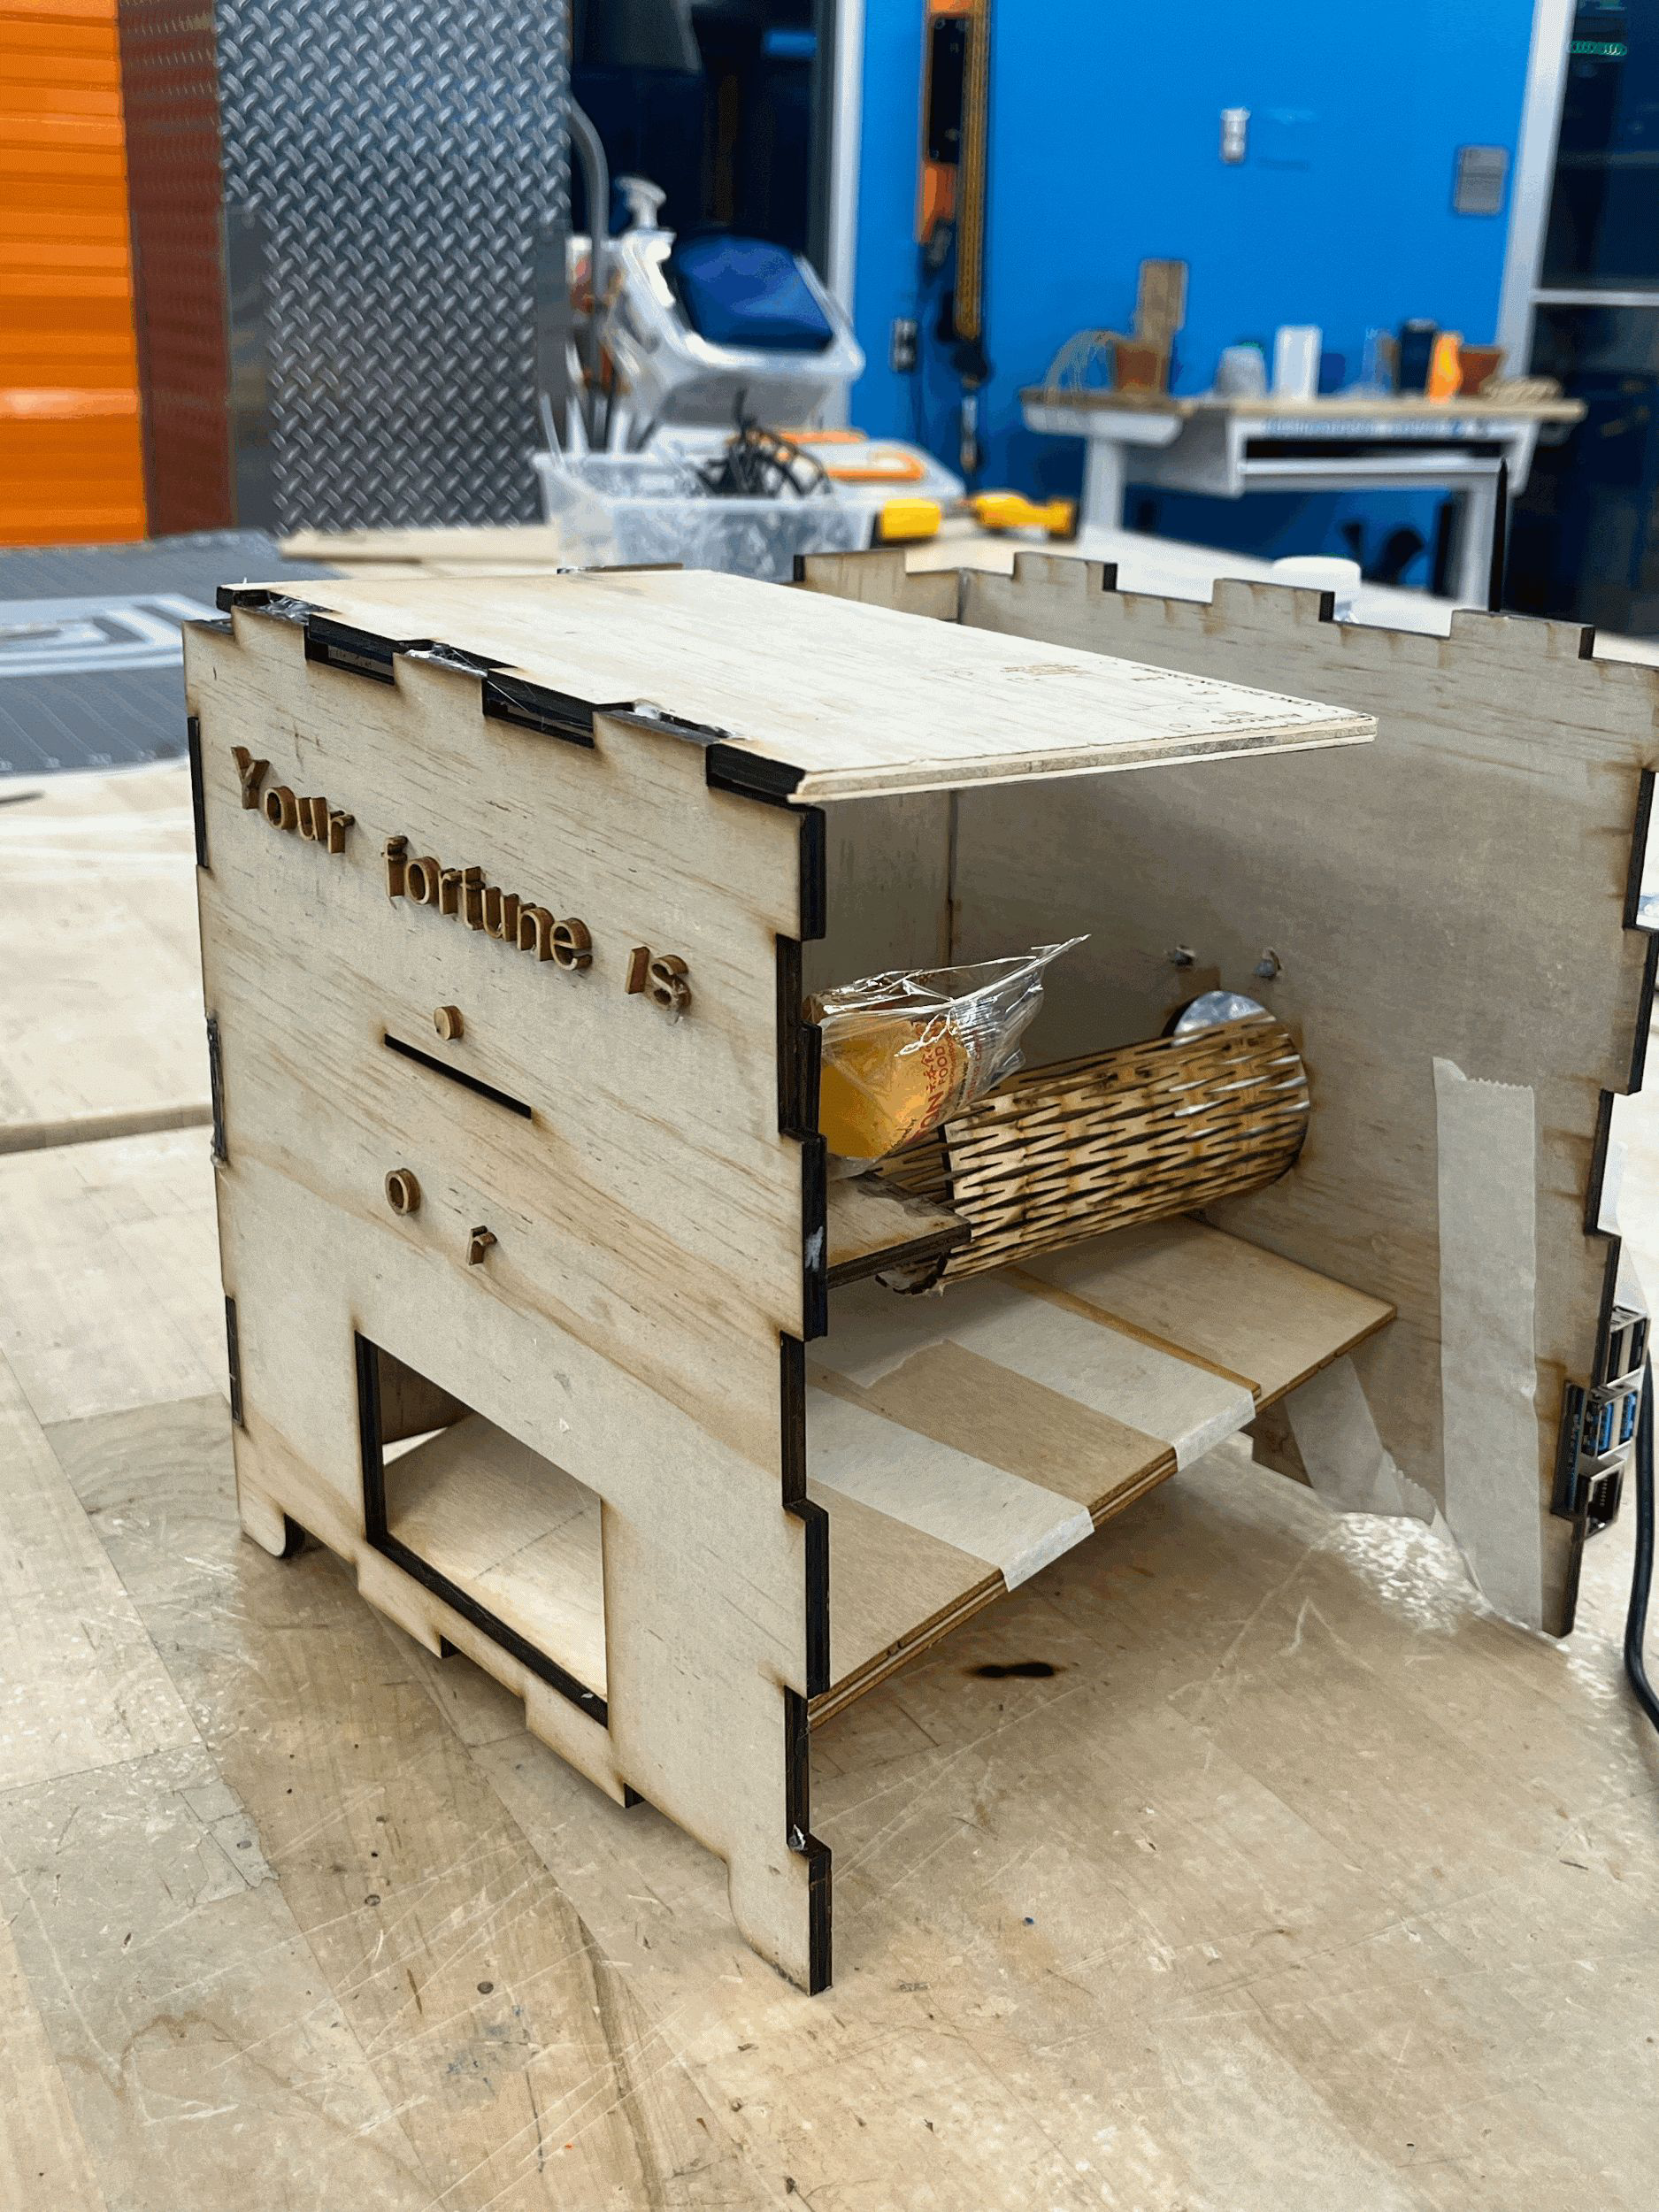
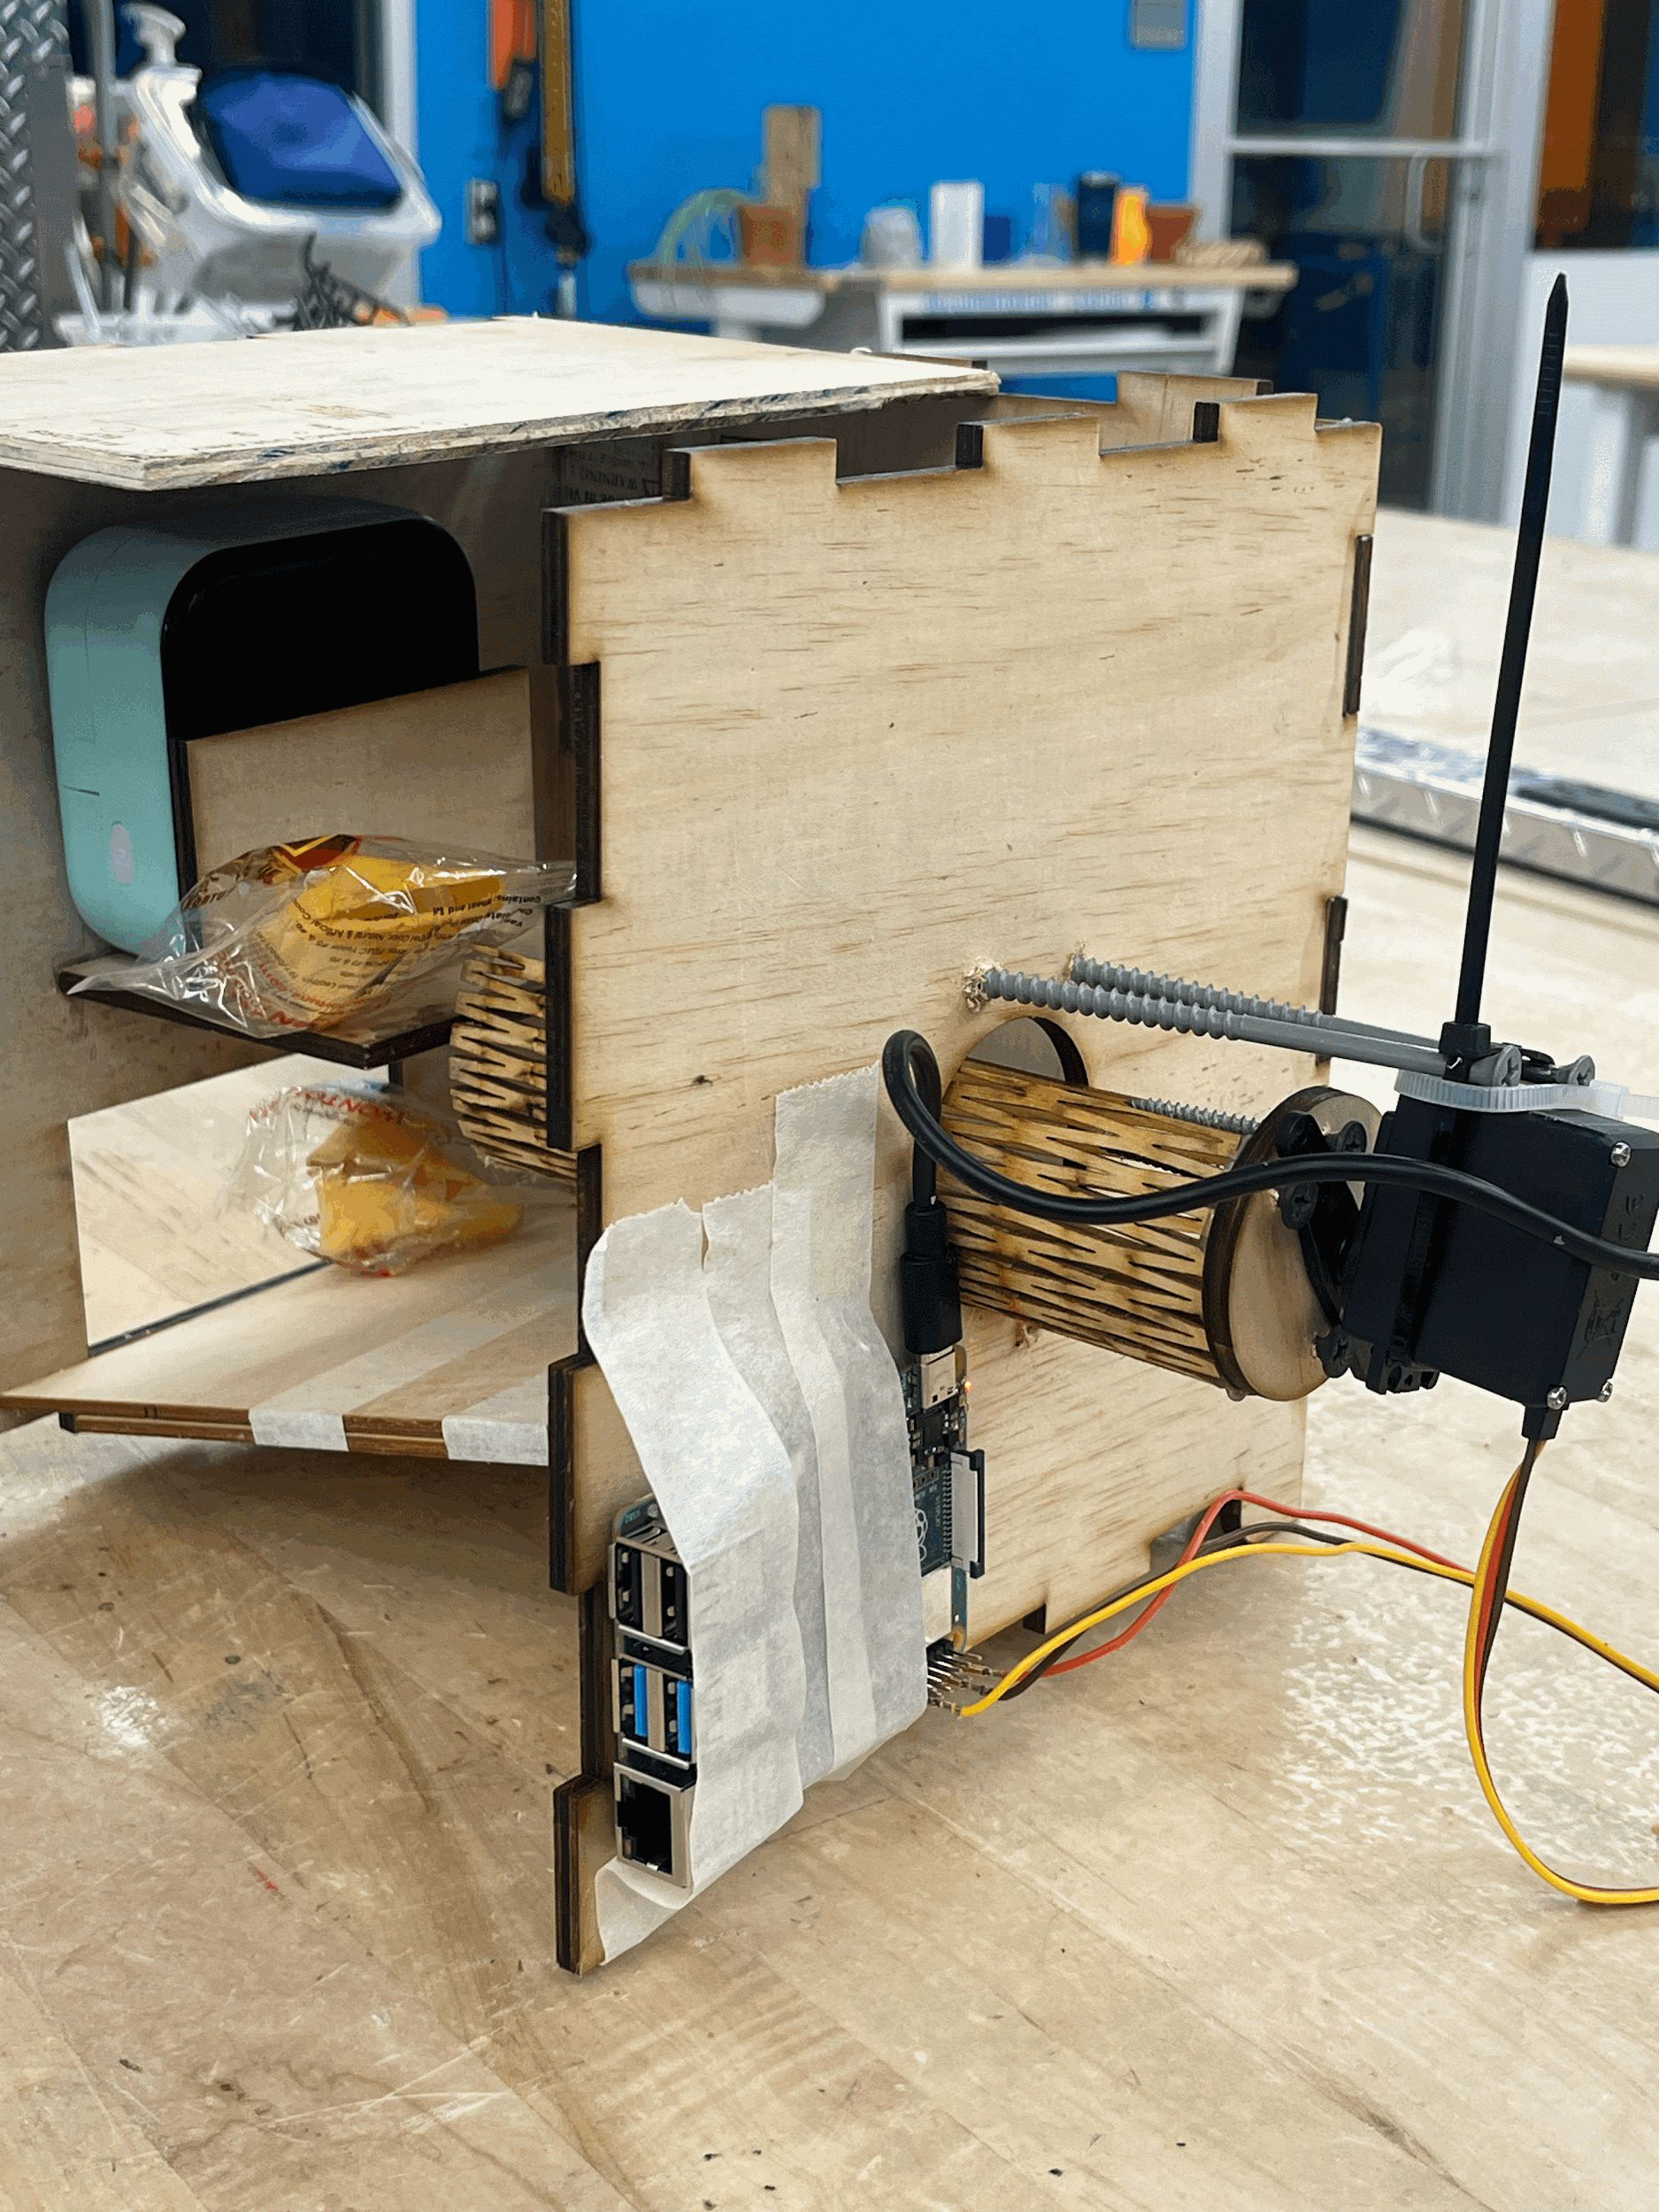
My second fabrication was a full plywood prototype of the kiosk created via laser cutting. This allowed me to visualize the placement of the servo motor, printer slot, and cookie collection tray all within a cohesive physical structure. I had to resize most parts twice to put this together but it was satisfying to see the kiosk take form and seeing how the dispensing mechanism works in real life. I considered pushing the next CAD iteration toward a better-functioning, customer-facing experience, but am very happy with the choice of an organic material that really compliments the warm and cozy feeling of the kiosk.
Software integration (more in technology class)
Cardboard prototype
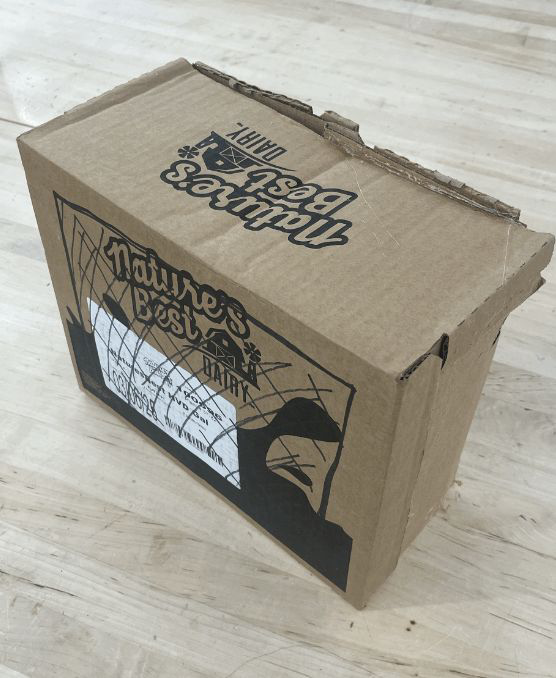
Initially I used cardboard to test out the sizing of the kiosk and understand how much space it should take up in a cafe or restaurant, and gradually downsized it to table top sizing so it is just enough to gauge attention and differentiate itself from ordering kiosk.
Future Steps
I will try to figure out a better way to fixate the motor and optimise the whole kiosk so it is less flimsy.